IB Economics: Costs of Production Review Activity
advertisement
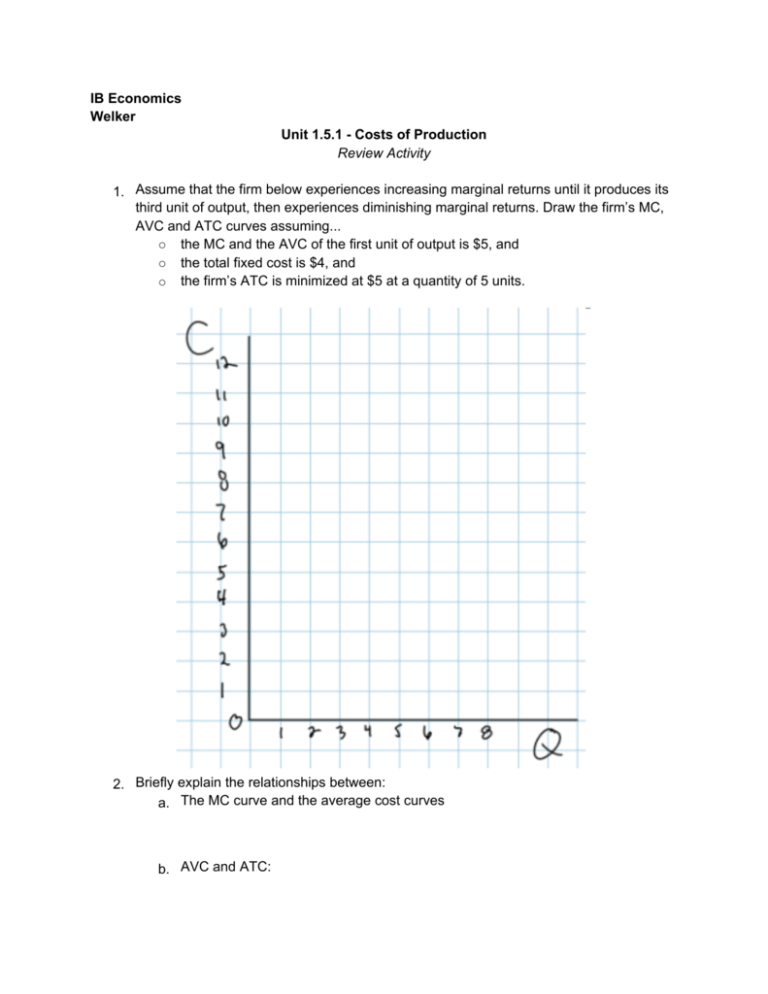
IB Economics Welker Unit 1.5.1 - Costs of Production Review Activity 1. Assume that the firm below experiences increasing marginal returns until it produces its third unit of output, then experiences diminishing marginal returns. Draw the firm’s MC, AVC and ATC curves assuming... ○ the MC and the AVC of the first unit of output is $5, and ○ the total fixed cost is $4, and ○ the firm’s ATC is minimized at $5 at a quantity of 5 units. 2. Briefly explain the relationships between: a. The MC curve and the average cost curves b. AVC and ATC: 3. Assume this firm’s fixed costs rose to $6. Show and explain the effect higher fixed costs would have on the firm’s short-run cost curves. Explain: 4. Now assume the wages the firm had to pay its workers decreases. Show the effect of the lower wage rate on the firm’s costs of production. Explain: 5. Assume the government levies a per unit tax of $2 on the firm’s output. Show and eplain the effect a per unit tax levied by the government will have on the firm’s short-run cost curves. Explain: 6. Next assume the government eliminates a lump sum tax on the firm. A lump sum tax is a fixed amount paid by the firm to the government regardless of its level of output. Show and explain how the reduction of such a tax would affect the firm’s short-run costs of production. Explain: 7. Assume this firm sells its product in a perfectly competitive market and is just one of a thousand firms selling a homogeneous product, and the equilibrium price of its product is $8. In the graph on the left, illustrate the market equilibrium price and output level. In the graph on the right, illustrate the individual firm’s demand and marginal revenue curve based on the market equilibrium. (you must change the labels in the graph on the left to “P” instead of “C” and “Q in thousands” instead of “Q”) 8. Explain the relationship between the price in the market and the Demand and Marginal Revenue experienced by the individual firm: 9. On the graph you drew in #7, identify the quantity of output the firm will wish to produce to maximize its economic profits. (Profit maximization occurs when a firm produces where its marginal cost equals the marginal revenue). 10. Identify the firm’s average total cost at the profit maximizing level of output, and shade the area on the graph representing the firm’s economic profits or losses. 11. Based on the additions to your graph made in #10, explain why the firm is earning economic profits, earning losses, or breaking even. 12. Knowing that perfectly competitive markets have very low barriers to entry and exit, and that the firm in your graph represents all firms in this particular market, explain what will happen to the number of firms in the long-run given the existence of the economic profits or losses you identified on your graph. 13. Show in the graph on the left (below) the changes that will occur in the long-run described in your answer to #12. In the graph on the right, show how these changes affect the typical firm in the market. 8. 14. Explain why firms in perfectly competitive markets are only able to earn a normal profit in the long-run.

