stock analysis
advertisement
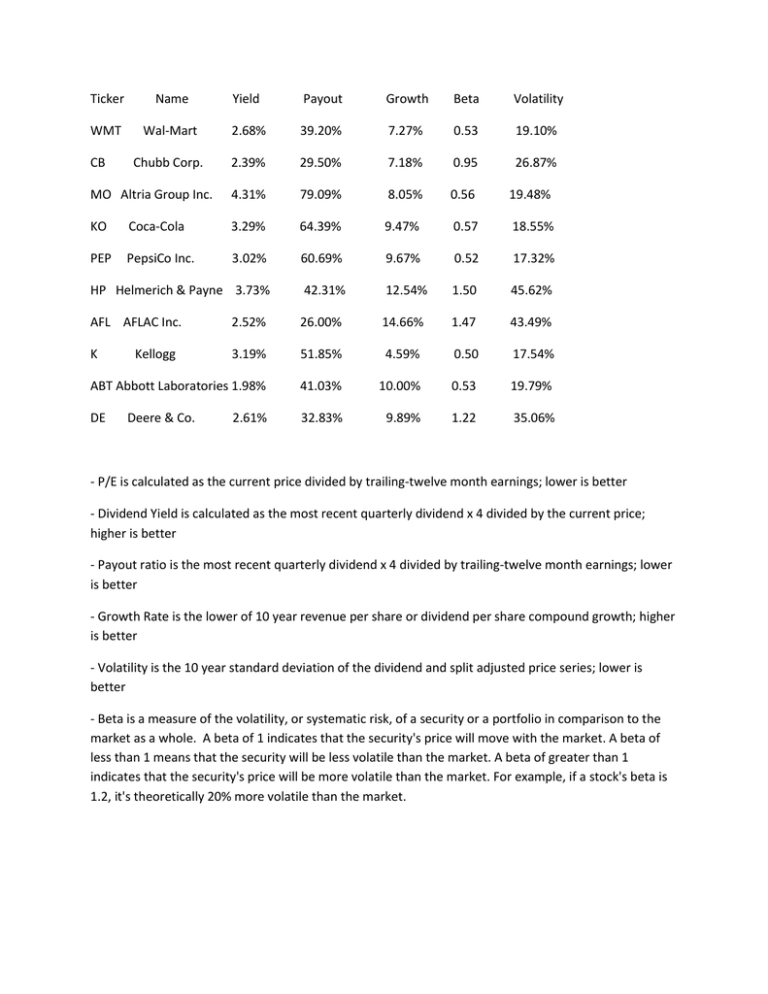
Ticker Name Yield Payout Growth Beta Volatility WMT Wal-Mart 2.68% 39.20% 7.27% 0.53 19.10% Chubb Corp. 2.39% 29.50% 7.18% 0.95 26.87% MO Altria Group Inc. 4.31% 79.09% 8.05% 0.56 19.48% KO Coca-Cola 3.29% 64.39% 9.47% 0.57 18.55% PEP PepsiCo Inc. 3.02% 60.69% 9.67% 0.52 17.32% HP Helmerich & Payne 3.73% 42.31% 12.54% 1.50 45.62% AFL AFLAC Inc. 2.52% 26.00% 14.66% 1.47 43.49% K 3.19% 51.85% 4.59% 0.50 17.54% ABT Abbott Laboratories 1.98% 41.03% 10.00% 0.53 19.79% DE 32.83% 9.89% 1.22 35.06% CB Kellogg Deere & Co. 2.61% - P/E is calculated as the current price divided by trailing-twelve month earnings; lower is better - Dividend Yield is calculated as the most recent quarterly dividend x 4 divided by the current price; higher is better - Payout ratio is the most recent quarterly dividend x 4 divided by trailing-twelve month earnings; lower is better - Growth Rate is the lower of 10 year revenue per share or dividend per share compound growth; higher is better - Volatility is the 10 year standard deviation of the dividend and split adjusted price series; lower is better - Beta is a measure of the volatility, or systematic risk, of a security or a portfolio in comparison to the market as a whole. A beta of 1 indicates that the security's price will move with the market. A beta of less than 1 means that the security will be less volatile than the market. A beta of greater than 1 indicates that the security's price will be more volatile than the market. For example, if a stock's beta is 1.2, it's theoretically 20% more volatile than the market.


