University of Missouri
advertisement
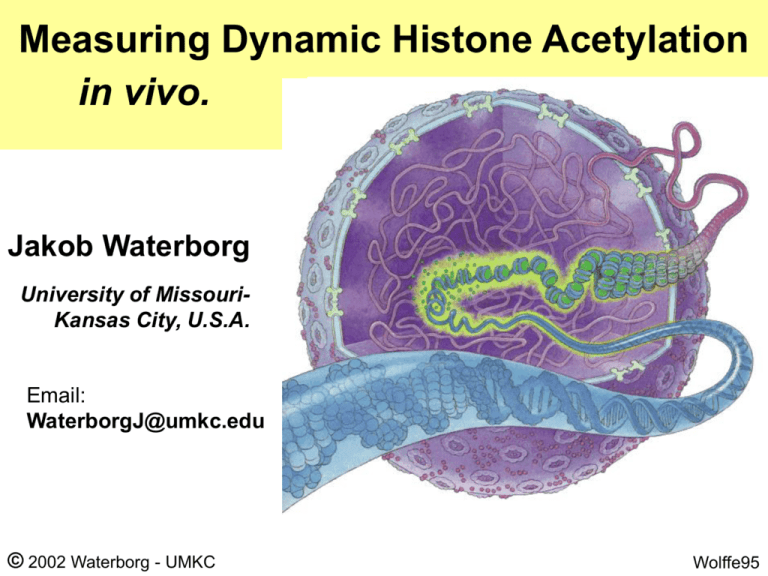
Measuring Dynamic Histone Acetylation in vivo. Jakob Waterborg University of MissouriKansas City, U.S.A. Email: WaterborgJ@umkc.edu © 2002 Waterborg - UMKC Wolffe95 Papers discussed Saccharomyces cerevisiae, baker’s yeast Dynamic acetylation: • Waterborg (2001) Biochemistry 40, 2599-2605 Histone preparation and fractionation: • Waterborg (2000) J. Biol. Chem. 275, 13007-13011 Chlamydomonas reinhardtii algae Dynamic acetylation: • Waterborg (1998) J. Biol. Chem. 273, 27602-27609 Histone preparation and fractionation: • Waterborg et al. (1995) Plant Physiol. 109, 393-407 © 2002 Waterborg - UMKC Function of Histone Acetylation 30 nm 11 nm HIGH in histone H1 + charged histone tail acetylated histone tail © 2002 Waterborg - UMKC Often low in histone H1 Histone Acetylation Enzymes Lysine in histone: cell membrane N O C C g a b C C C d O O e C N+ O [3H]-Ac C O Acetyl-CoA HAT (Histone - HDAC AcetylTransferase) C O (Histone DeACetylase) CoA N Uncharged Acetyl-Lysine in histone C O C C C C e C C N C O © 2002 Waterborg - UMKC DNA P O Acetylated Histones – a choice N-terminus of histone H3 ++ + + H3N- ARTKQTARKS + 9 5 m m + ++ TGGKAPRKQL 18 14 + ++ ASKAARKSAP… 23 27 3-6 Ac m H3 : 3-6Ac H2B : 3-6Ac H4 : 4 or 5 Ac N-terminus of histone H4 + ++ ++ + + + + Ac-HN- SGRGKGGKGL GKGGAKRHRK ILR… 8 16 20 5 12 4 or 5 Ac (m) Note the “standard” colors for the core histones © 2002 Waterborg - UMKC H2A : 1-2Ac Preparation of Histones 1. Break cells – collect nuclei Yeast: glass-beading (fast) Chlamydomonas: cell-wall-less mutant 2. Extract with acid: 0.4 N H2SO4 or HCl Chaotropic extraction by >20% guanidine.HCl pH 6.8 3. Collect histones by precipitation (acetone or TCA) Dialysis into 2.5% acetic acid (remove all salt) Lyophilization until dry © 2002 Waterborg - UMKC Separation of Histones 4. Reversed-phase C18 HPLC Absorbance 0-60% acetonitrile gradient H2B H1.2 H4 H2A H3 H1.1 20 40 60 Chlamydomonas histone extract 5. Acid-Urea gel electrophoresis © 2002 Waterborg - UMKC 80 min SDS or AU Gel Electrophoresis ? AU (Acetic Acid – Urea) SDS Gel system: 1M acid, pH ~3 in 5-8 M urea size + charge Separation by: size electrode: _ + ++ ++ H3 H4 135 aa 135 aa H3 H3 H4 102 aa electrode: + ++ + H4 102 aa _ Densitometry of Coomassie dye © 2002 Waterborg - UMKC Gel scans: alfalfa histones (Waterborg, 90’s) How to Detect Histone Acetylation? (fluorograph) Alfalfa histone H4 Lysine acetylation at 5, 8, 12, 16 and 20 © 2002 Waterborg - UMKC Measure Post-translational Acetylation AcLysines: 5 Fluorograph 4 3 2 1 0 Chlamydomonas H4 60 min *Ac label Coomassie Fluorograph top of gel + © 2002 Waterborg - UMKC 2 min *Ac pulse label +chx – top of gel Acetylation of Yeast histone H4 30 min 120 min 120 min 120 min [3H]-Ac [3H]-Ac [3H]-lysine + + [3H]-Ac – – cycloheximide Ac Ac Coomassie Fluorograph (film) © 2002 Waterborg - UMKC Acetylation of histone H3 Chlamydomonas H3 Saccharomyces H3 60min *Ac Coomassie Coomassie 2 min *Ac +cycloheximide 30 min *Ac +cycloheximide 54 3 21 0 3 5 4 0 3 4 2 5 1 (top) AUT gel © 2002 Waterborg - UMKC (bottom) (top) AUT gel 2 1 0 (bottom) Acetate Labeling in Yeast Outside yeast cell Inside yeast cell (glucose in YPD growth medium) Glucose represses Active acetate transport pH7 pH4 pH7 *Ac added: 2,000 nM H+ Ac– 1,980 nM <600 nM Diffusion HAc 20nM 1% > 1,400 nM slow equilibration to 2,000 nM HAc H+ rapid accumulation Ac– to >> 2,000 nM Ac HAc pKa = 4.76 Nelson (1982) J.Biol.Chem. 257, 1565 © 2002 Waterborg - UMKC *Acetate Labeling in Chlamydomonas Coom 0 2 6 12 20 60 min Coom 0 2 6 12 20 60 min 5 5 0 H3 100 2 50 T1/2 0 5 3 4 0 max 0 1 Ac label 1 50 H4 100 2-5 Ac label 0 10 © 2002 Waterborg - UMKC 20 min 60 0 10 20 min 60 Pulse-chase Label Protocol exponential decay of specific label % specific label 1 50 "pulse label" Specific radioactivity 100 0.1 half-life T1/2 0.01 0 15time 20 10 "chase" 0 0 5 10 20 30 40 50 time © 2002 Waterborg - UMKC 60 70 80 90 100 Specific radioactivity (%) Pulse-chase *Ac Labeling 100 Pulse = 2 min 10M *Acetate. Chase = at 2 min: add 1 volume of growth medium with 9.34 mM NH4Ac (1,000x excess). 80 60 “chase” 40 “normal” labeling 20 0 0 10 © 2002 Waterborg - UMKC 20 30 min 60 Steady-State Labeling Protocol % specific label exponential rise of specific label to steady-state condition maximum 100 steady-state 50 Mathematical fit of data to “exponential rise to maximum” yields T1/2 half-life value. half-life T1/2 "continuous label" 0 0 10 20 30 40 50 time © 2002 Waterborg - UMKC 60 70 80 90 100 *Acetate Labeling in Yeast cpm/prep HPLC data cpm/peak non-histone protein HPLC peak (at 95 min) 15000 15,000,000 total *Ac label 10000 10,000,000 5,000,000 5000 histone“steady-state” labeling: apparent "steady-state" 0 0 10 20 30 40 min © 2002 Waterborg - UMKC 50 60 0 70 Half-life Measurement in Yeast H4 Specific radioactivity Coom Histone H4 HPLC 1500 gel 1.5 min with *Ac (+chx) -chx 2 5 10 15 20 3150 71 100 1000 1.0 500 0.5 0.0 0 0 98-day fluorograph © 2002 Waterborg - UMKC 30 60 min Half-life Measurement in Yeast H3 Specific radioactivity Coom Histone H3 min with *Ac (+chx) -chx 2 5 10 15 20 31 50 71 100 gel 1.5 HPLC 1000 1.0 500 0.5 0.0 0 0 98-day fluorograph © 2002 Waterborg - UMKC 30 60 min Acetylation Turnover in Yeast Histones Turnover rates of post-translational acetylation in Saccharomyces cerevisiae histone half-life in YPD medium half-life in SD medium H4 H3 21 ± 5 8 ± 2 H2B H2A 4±1 6±2 14 ± 1 12 ± 4 4 ± 1 5 ± 3 © 2002 Waterborg - UMKC Turnover across Acetylated H4 Forms H4 acetylation turnover in YPD 35 H4 half-life (min) 30 25 Conclusion: Multi-acetylated forms of yeast histone H4 turn over faster than mono-acetylated forms. 20 average half-life 15 10 5 0 1 2 3 4 # AcLys per H4 © 2002 Waterborg - UMKC Turnover across Acetylated H3 Forms H3 acetylation turnover in YPD 20 half-life (min) H3 15 Conclusion: Rates of turnover are the same for mono- up to penta-acetylated forms in yeast histone H3. regression fit 10 5 0 1 2 3 4 5 # AcLys per H3 © 2002 Waterborg - UMKC Acetylation Turnover in Chlamydomonas Add chx at t = –15 min Add 200 M NH4Ac at t = –5 min Add 10 M NaAc (2 mCi [3H]-Ac) at t = 0 min Add chx at t = –10 min Add 10 M NaAc (2 mCi [3H]-Ac) at t = 0 min label (%) hplc label (%) 100 100 gel 80 60 50 40 20 0 0 0 10 20 30 min 60 0 10 data for H2B © 2002 Waterborg - UMKC 20 min 30 Comparing Histone Acetylation Turnover Histone: H4 H3 H2B H2A Chlamydomonas (algae) 3.5 ± 1.1 1.7 ± 0.2 1.4 ± 0.3 2±1 Saccharomyces (yeast-fungi) ~17 ~10 4 6 30 ± 11 35 ± 13 26 ± 9 28 ± 5 — Half-life (min) Turnover half-life (min) Medicago H3.1 (alfalfa-plant) H3.2 4 Chlamydomonas H3 3 2 1 0 1 2 © 2002 Waterborg - UMKC 3 4 5 #Ac/H3 Steady-state Specific Labeling of H3 4 4 5 3 label 3 2 2 1 1 time Standard label at "max" 0 5 4 3 2 1 0 © 2002 Waterborg #Ac/H3 1 2- UMKC 3 4 5 #Ac/H3 Turnover 5 82 ± 17 % 4 106 ± 10 % 3 104 ± 20 % 2 92 ± 9 % 1 100 ± 17 % H3 total 100 ± 12 % Extent of Acetylation Turnover 5 Chlamydomonas H4 Standard label at "max" Standard label at "max" Chlamydomonas H3 100% 4 3 2 1 0 3 4 3 <50% 2 1 Yeast H3 100% 4 ~50% 2 1 0 #Ac/H3 1 #Ac/H4 1 5 Standard label at "max" Standard label at "max" 2 5 3 100% 4 0 #Ac/H3 1 6 5 5 2 4 Yeast H3 100% 4 3 3 <40% 2 1 0 2 3 © 2002 Waterborg - UMKC 4 5 #Ac/H4 1 2 3 4 5 Conclusions 1. Measure dynamic acetylation by steady-state labeling in vivo. 2. Histone acetylation half-lives per acetylation level. 3. Information about chromatin environments from whole-cell studies. © 2002 Waterborg - UMKC Thank you for your attention © 2002 Waterborg - UMKC

