PPT - Mid Day Meal Scheme
advertisement
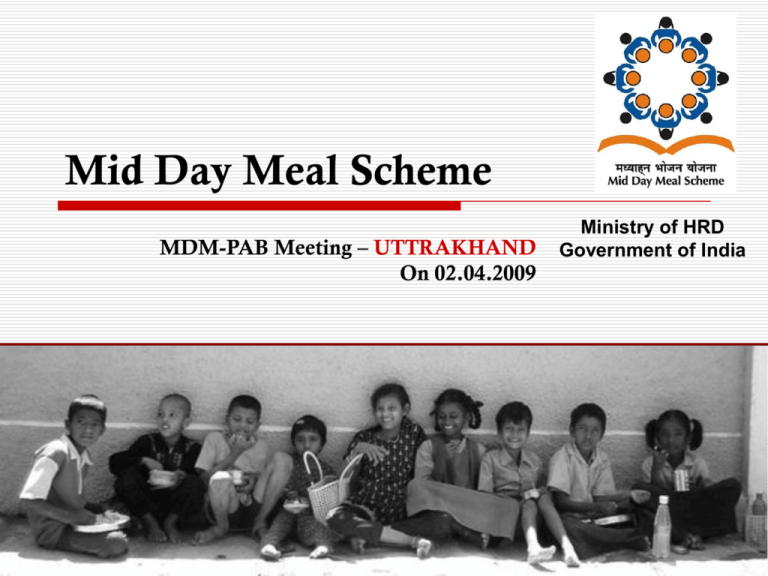
Mid Day Meal Scheme MDM-PAB Meeting – UTTRAKHAND On 02.04.2009 Ministry of HRD Government of India 1 Part-I Review of Implementation of MDMS in UTTRAKHAND (Primary + Upper Primary) (1.4.2008 to 31.12.2008) Ministry of HRD, Govt. of India Questions? What is the level of unspent balances as on 31.03.08? How regular is the lifting of food grains? Is there any disruption/shortage in availability of food grains? What is the level of lifting? How about cooking cost? Was it disbursed to Districts? What is the level of its utilisation at school level? How utilisation of food grains and cooking cost is synchronized? How is the utilisation of foodgrains reconciled with the number of meals served? …… contd Ministry of HRD, Govt. of India Contd ….., Questions? How much MME was utilized? Under what activities? What is the progress in construction of Kitchen Sheds and procurement of kitchen devices? Part –II What is the trend in Enrollment and No. of children availing MDM from 2007 to 2008? How well MDM data compares with SSA data and Census data? Ministry of HRD, Govt. of India Benchmarks Desirable stock in hand : 10% (+ or - 5%) Lifting of food grains as on 31-12-08 : 85% Utilisation of foodgrains and cooking cost [1.4.08 to 31.12.08]: 73% (+ or – 10%) Every month 1/12th of foodgrains is required to be lifted & distributed. Utilisation of foodgrains & cooking cost should be synchronous. State’s AWP&B should be in accordance with MHRD’s guidelines. Data in the AWP&B should be authentic, reliable & based on the records. Ministry of HRD, Govt. of India No. of Schools Covered (PY + UP.PY) 20000 18229 18000 17484 16000 14000 96% covered 12991 97% covered 12615 12000 10000 8000 5238 6000 93% covered 4869 4000 2000 0 P rim ary No. of Ins titutes Uppe r P rim ary T otal (P Y + U P Y ) No. of Ins titutes s erv ing MDM Only 04% of the P+UP Schools are not covered under MDM PAB Approval Vs State Performance (No. of children in Q1+Q2+Q3) 11.25 12.00 9.75 No. of children (In lakh) 10.00 8.00 7.31 87% Covered 95% Covered 6.97 6.00 3.93 4.00 71% Covered 2.78 2.00 0.00 P rim ary A s per P A B A pprov al Ministry of HRD, Govt. of India Uppe r P rim ary T otal (P Y + U P Y ) A s per S tate (A c tuals ) Break-up of children not covered Type of schools No. of Avg. no. of children children approved by Availing PAB (2008- MDM as on 2009 31-12-08 Non coverage No Govt+LB+GA EGS/A.I.E. Total 10,78,928 45,621 1,12,4549 Ministry of HRD, Govt. of India 9,58,714 16,398 9,75,112 120,214 29,223 149,437 % -11% -64% -13% PAB Approval Vs State Performance (No. of Working Days in Q1+Q2+Q3) 250 No. of Working days 203 (100%) 200 149 150 (73%) 160 (78%) 100 50 0 P AB Approv al for F Y- P AB Approv al for Q1, As per S tate (Ac tuals ) 2008-09 Q2, Q3 Q1, Q2, Q3 Ministry of HRD, Govt. of India PAB Approval Vs State Performance (No. of Meals in Q1+Q2+Q3) 22.83 25.00 No. of Meal (in Crore) 20.00 Benchmark 73 % 100% 16.75 73% meals to be served 15.60 68 % meals served 15.00 10.00 5.00 0.00 A s per P A B A pprov al A s per P A B for F Y-2008-09 A pprov al(Q1+Q2+Q3) A s per S tate (Q1+Q2+Q3) PAB Approval 08-09 7.31 lakhs. Children X 203 Working days = 22.83 Cr. Meals. PAB(Q1+Q2+Q3) 11.2 lakhs. Children X 149 Working days = 16.75 Cr. meals (100%) State(Q1+Q2+Q3) 9.7 lakhs. Children X 160 Working days = 15.60 Cr. meals (93%) Analysis: Foodgrains Availability (1.4.08 to 31.12.08) 30000 26822 100% Foodgrains (in MTs) 25000 Benchmark 83% 20000 14853 15000 55% 10000 5000 1052 0 Uns pent balance Ministry of HRD, Govt. of India Allocation( as per requirement)/P AB L ifting B y the s tate(Q 1+Q 2+Q 3) Food grains lifting Month-wise cumulative (Including USB*) 25000 20116 17881 15905 15646 Foodgrains (in MTs) 20000 15000 13411 10000 5000 0 11770 11176 9356 8941 6705 4470 7682 5358 2912 3399 2235 1052 1052 A pr* May J un J ul C um A c tual lifting A ug S ep Oct C um Ideal lifting Including unspent balance of 1052 MTs as on 31.3.2008 Ministry of HRD, Govt. of India Nov D ec Foodgrains Utilisation (Q1+Q2+Q3) 30000 26821.8 100% Foodgrains (in MTs) 25000 Benchmark 73% 20000 15904.77 15000 (55+4)% 12202.09 45% 10000 5000 0 Allocation( as per requirement) Ministry of HRD, Govt. of India Availability(US B +L ifted) Utilis ation(Q 1+Q 2+Q 3) Cooking Cost Utilisation (1.4.2008 to 31.12.2008) C ooking C os t (In L akhs ) 7000.00 6665.88 100% 6000.00 Benchmark 73% 5000.00 4000.00 3573.87 3092.01 3000.00 46% 2000.00 1000.00 0.00 Allocation( as per requirement) Ministry of HRD, Govt. of India Utilis ation(Q 1+Q 2+Q 3) Un-utiliz ed 54% Mismatch in Utilisation of foodgrains and cooking cost (District-wise) 50% 49% Benchmark : 73% 47% % Utilisation 45% 42% 42% 43% 43% 43% 40% 30% C hamoli P auri F oodg rains Ministry of HRD, Govt. of India Almora C ooking C os t B ag es hwar Reconciliation in Utilisation of foodgrains vs. No of meals served (District-wise) Actual No. of Expected Consumpti Meals consumpti on of food No District served on grains Diff. Diff.(%) 1 Haridwar 26504965 3000 1502 -1499 -50% 2 Tehri 18083402 2121 1150 -971 -46% 3 USNagar 27181932 3058 1754 -1304 -43% 4 Champawat 5609288 624 383 -241 -39% 5 Pithoragarh 9419923 1079 707 -372 -35% 6 Uttarkashi 8104241 949 641 -308 -32% 7 Chamoli 8350934 935 633 -302 -32% 8 Nainital 14219678 1623 1209 -415 -26% 9 Bageshwar 4439554 506 383 -123 -24% 10 Rudraprayag 4449079 506 407 -99 -19% 11 Dehradun 12248059 1423 1237 -186 -13% 12 Pauri 11410379 1223 1086 -137 -11% 13 Almora 10954051 1205 1110 -95 -8% Ministry of HRD, Govt. of India MME Utilisation (1.4.08 to 31.12.08) 120.00 104.98 100% MME (In L akhs ) 100.00 80.00 72.99 70% 52.49 100% 60.00 40.00 30% 31.99 55% 21.31 20.00 01% 0.20 0.00 Allocation E xpenditureS chool levelManag ement E val. E xp. E xp. E xp. Ministry of HRD, Govt. of India Uns pent B alance Transport Assistance Utilisation T rans port A s s is tanc e (In L akhs ) (1.4.08 to 31.12.08) 400.00 100% 350.00 335.26 Benchmark 73% 300.00 250.00 56% 44% 200.00 186.59 148.67 150.00 100.00 50.00 0.00 Allocation( as per requirement) Ministry of HRD, Govt. of India E xpenditure(Q 1+Q 2+Q 3) Uns pent B alance Achievement during 2008-09 (Kitchen Sheds) 4973 4972 100% 2983.52 P hys ical (units ) Allocated Ministry of HRD, Govt. of India 2983.2 100% F inancial (L akhs ) Achievement (C + IP ) Achievement during 2008-09 (Kitchen Devices) 18475 120% 15376 769 P hys ical (units ) Allocated Ministry of HRD, Govt. of India 769 F inancial (L akhs ) Achievement (C +IP ) 100% Performance Score card – A Summary Sl. No. Component Achievement Benchmark 1. Foodgrains Utilisation 45% 73% 2. Cooking Cost Utilisation 46% 73% 3. MME Utilisation 70% 75% 4. Kitchen Shed construction 100% 100% 5. Kitchen Devices procurement 100% 100% 6. QPRs 3 nos. 3 nos. Ministry of HRD, Govt. of India Observations of Monitoring Institute National Institute of Administrative Research, Mussoorie Districts Covered: Tehri, Dehradun, Rudraparyag The report states that MDM is implemented in all the Govt. primary schools and in EGS centers. In all the sample schools MDM is served regularly. In most of the cases prescribed menu is not following in the preparation of the food. Mostly menu is without vegetables. The provision of Bhojan Mata has been employed for preparing MDM. Participation of community/VEC panchayats in the MDM is very low. Analysis of State’s Proposal for 2009-10 Ministry of HRD, Govt. of India Time Series – No. of Children (PRIMARY) 9 No. of children (in lakhs) 8 7.66 6% Decreased 7% Decreased 7.38 7.23 7 6.90 6 5 4 3 2 1 0 MDM Enrolment Availing MDM 2007-08 Ministry of HRD, Govt. of India 2008-09 Primary School Enrolment – SSA [Govt. + Govt.-aided + LB) Vs MDM No. of children (in lakhs) 9 8.18 7.66 8 06% Decreased 7.23 7 6 5 4 3 2 1 0 E nrollment S S A-2007-08 Ministry of HRD, Govt. of India MD M-2007-08 MD M-2008-09 Population Vs Enrolment Vs Availing MDM (PRIMARY) No. of children (in lakhs) 12 10 8 9.83 4% Decreased 7.667.38 9.83 5% Decreased 7.23 6.90 6.90 6 4 2 0 2007-08 P opulation Availing MDM Ministry of HRD, Govt. of India 2008-09 2009-10 MDM E nrolment S tate's demand 2009-10 Population Vs Enrolment Vs Availing MDM during 2008-09(UPPER PRIMARY) No. of children (in lakhs) 7 6.04 6 6% Decreased 5 3.81 4 4.19 3.96 3 2 1 0 2008-09 P opulation(11-13) S S A-E nrollment(07-08) MDM E nrolment No. of children availing MDM Ministry of HRD, Govt. of India No. of School days No 1 2 Year 2006-07 2007-08 As per DISE data 203 213 As per MDM Sanctions 233 220 3 2008-09 NA 203 4 2009-10 NA 228(State Claim) PAB’s Recommendations (2009-10) No 1 2 2.1 2.2 Details Children availing MDM Primary Upper Primary TOTAL (B) No. of Working days Primary Upper Primary As per State Plan (Table No.16/16-A) Recommendations by Appro Appraisal Team val by MDMPAB 6,90,453 3,95,741 10,86,194 7,31,105 3,93,444 11,24,549 228 228 203 203 Thank You Ministry of HRD, Govt. of India
