File - McKenzie Doran, Project lead The way Biomed
advertisement

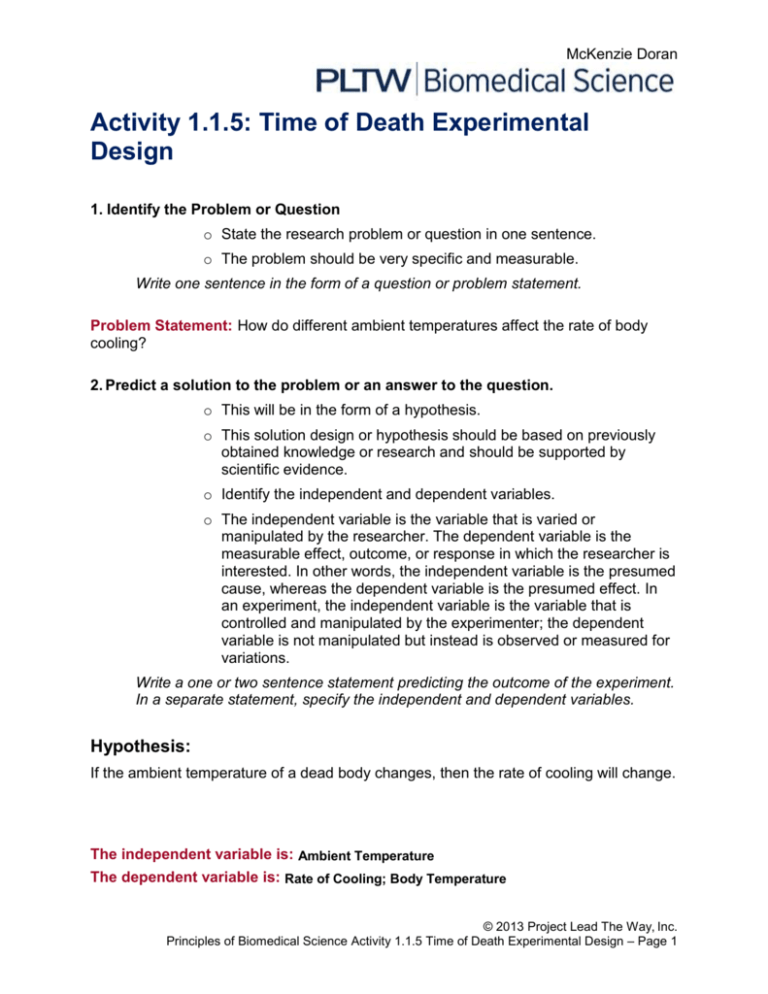
McKenzie Doran Activity 1.1.5: Time of Death Experimental Design 1. Identify the Problem or Question o State the research problem or question in one sentence. o The problem should be very specific and measurable. Write one sentence in the form of a question or problem statement. Problem Statement: How do different ambient temperatures affect the rate of body cooling? 2. Predict a solution to the problem or an answer to the question. o This will be in the form of a hypothesis. o This solution design or hypothesis should be based on previously obtained knowledge or research and should be supported by scientific evidence. o Identify the independent and dependent variables. o The independent variable is the variable that is varied or manipulated by the researcher. The dependent variable is the measurable effect, outcome, or response in which the researcher is interested. In other words, the independent variable is the presumed cause, whereas the dependent variable is the presumed effect. In an experiment, the independent variable is the variable that is controlled and manipulated by the experimenter; the dependent variable is not manipulated but instead is observed or measured for variations. Write a one or two sentence statement predicting the outcome of the experiment. In a separate statement, specify the independent and dependent variables. Hypothesis: If the ambient temperature of a dead body changes, then the rate of cooling will change. The independent variable is: Ambient Temperature The dependent variable is: Rate of Cooling; Body Temperature © 2013 Project Lead The Way, Inc. Principles of Biomedical Science Activity 1.1.5 Time of Death Experimental Design – Page 1 McKenzie Doran 3. Design the experiment to be used to test your hypothesis. o o o o o Include a list of all materials used. Be specific. Take all safety concerns into account. Identify a control to be used for comparison if applicable. Control all outside variables that could affect the outcome of the experiment. o Clearly define how the data will be collected and recorded, including measurement units. o Design a data table to use to record information. o Plan the strategy that will be used to summarize the data. For example, a graph might be used to summarize the data. Write a series of numbered steps and include a list of required materials. The data table should include units that will be used to collect data. Materials: 3 Computers with Logger Pro software 3 Vernier Temperature Probes Goggles Gloves Laboratory apron Oven mitt 3 Ring stands with clamp 3 Test tubes Sodium polyacrylate (also known as waterlock) Weigh boats Electronic balance Thermometer 37˚C Water Graduated cylinder Hot water bath set to approximately 50˚C Ice water bath Room temperature water Procedure: 1. Wear the appropriate personal protective equipment. 2. Create the following three water baths: o A 250 mL beaker filled with 200 mL of water on a hot plate set to medium heat that is approximately 50˚C. © 2013 Project Lead The Way, Inc. Principles of Biomedical Science Activity 1.1.5 Time of Death Experimental Design – Page 2 McKenzie Doran o A 250 mL beaker filled with 200 mL of water at room temperature (approximately 20˚C). o A 250 mL beaker filled with 200 mL ice water (0˚C). 3. Obtain three test tubes and measure and place 1 gram of sodium polyacrylate into each. 4. Obtain three Vernier Temperature Probes, three analog thermometers, and three ring stands with clamps. 5. Start Logger Pro® software on the computers. 6. Click on File Open and open the Forensics with Vernier folder. 7. Open the program titled 14 Hot Air, Cold Body. 8. Connect the LabQuest Mini to each computer using USB cables. 9. Connect the Temperature Probes into CH 1 of the LabQuest Minis using the British Telecom connector. 10. Place the thermometer in the water baths to ensure that they maintain the correct temperatures. Record this temperature in the Evidence Record table. 11. Attach the Temperature Probes to the clamp on the ring stands. 12. Place 20 mL of 37˚ water into the test tubes. These represent dead bodies. 13. Place a test tube with waterlock representing the dead body in each of the three water baths. 14. Place a Temperature Probe in the center of each test tube with waterlock. 15. Wait for the temperature sensors to reach the temperature of the waterlock. Click to begin data collection. Note that the experiment is set to collect data for 20 minutes. 16. Make sure to maintain a constant temperature for your water baths throughout data collection. 17. When data collection is complete (data has been collected for 20 minutes), click the Statistics button, , to display a Statistics box. 18. Record the minimum temperature recorded and the maximum temperature recorded in the appropriate spot in the Evidence Record table for each water bath. 19. Record the temperature change and record in the Evidence Record table for each water bath. (Note: The temperature change is displayed in the Statistics box as Δy.) 20. Copy the graphs by placing the mouse cursor over the graph, left clicking, and then pressing both the Control and the C keys simultaneously. Paste the graphs into a Word document and save. To paste the graph, press both the Control and the V keys simultaneously. Repeat this step in order to copy and paste the Data Table into the Word document. Attach the graphs in the Results section below. 21. Repeat the experiment for a total of three trials. © 2013 Project Lead The Way, Inc. Principles of Biomedical Science Activity 1.1.5 Time of Death Experimental Design – Page 3 McKenzie Doran 4. Carry out the experiment. o Collect data. o Make observations. o Complete multiple trials. (Perform the procedure many times, collecting data each time.) Complete the data table. Include units and labels for each section. Evidence Record Assigned Temperature: Actual Temperature of Water Bath Maximum Temperature of Waterlock Minimum Temperature of Waterlock Temperature Change (˚C): (˚C): (˚C): Trial One 3.2˚C 29.1˚C 4.12˚C 24.98˚C Trial Two 0.6˚C 30.1˚C 1.6˚C 28.5˚C Trial Three 0.7˚C 32.2˚C 1.7˚C 30.5˚C (˚C): 5. Analyze the data and observations. o Make graphs or charts of the data. o Check that the independent and dependent variables are properly placed on any graphs. o Be logical and clear. o Look beyond the obvious. Make graphs and charts to visually and logically present the data. Write in paragraph form and include calculations showing all work. All analysis should be explained clearly and concisely. © 2013 Project Lead The Way, Inc. Principles of Biomedical Science Activity 1.1.5 Time of Death Experimental Design – Page 4 McKenzie Doran Graph: Class Results: Temp: Group 1 Temp Change (˚C): Group 2 Temp Change Group 3 Temp Change Group 4 Temp Change Group 5 Temp Change Average Temp Change (˚C): (˚C): (˚C): (˚C): (˚C): 7.7˚C 12.5˚C 5.282˚C 50˚C 2.3˚C 5.94˚C 0.7˚C Room temperature 10˚C 6.7˚C 8.94˚C 27.99˚C 22.23˚C (0˚C) 8.55˚C 25.11˚C © 2013 Project Lead The Way, Inc. Principles of Biomedical Science Activity 1.1.5 Time of Death Experimental Design – Page 5 McKenzie Doran 6. State the conclusion. o Use a one sentence statement. o Be clear and concise. Write a one sentence statement directly related to the original hypothesis. It might start with “The hypothesis was correct…” Conclusion: The hypothesis was correct in that the ambient temperature of a dead body does change the rate of cooling. 7. Summary Paragraph o Write a brief paragraph. o Explain the rationale for your conclusion. o Clarify details. Write one paragraph of text explaining the rationale for the conclusion. Summary Paragraph: A dead body always wants to become the same temperature as the air around it, so it tries to get there as fast as possible. This means that the rate of cooling will change if the ambient temperature is lower or higher than the temperature of the body. The change in the rate of cooling depends on how drastic the difference between the body and air around it. Because of this, the rate of cooling has to be considered in figuring out the time of death, and you will use the Glaister equation to figure out time of death because it considers the changes in rate of cooling. © 2013 Project Lead The Way, Inc. Principles of Biomedical Science Activity 1.1.5 Time of Death Experimental Design – Page 6


