Investigating Oceans
advertisement
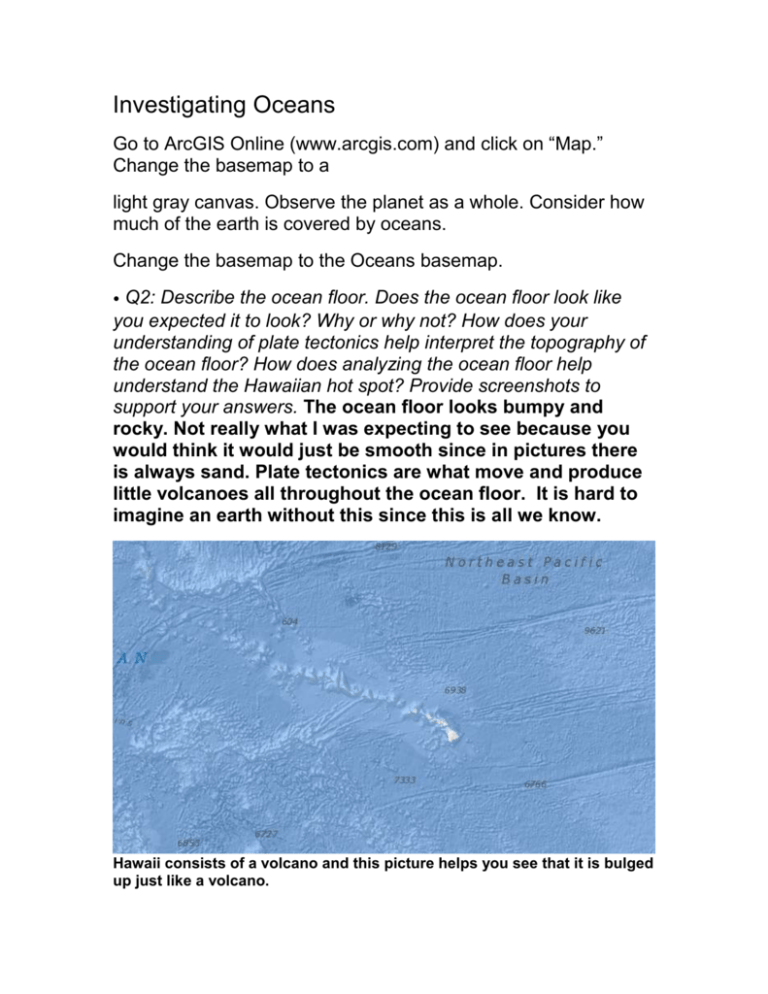
Investigating Oceans Go to ArcGIS Online (www.arcgis.com) and click on “Map.” Change the basemap to a light gray canvas. Observe the planet as a whole. Consider how much of the earth is covered by oceans. Change the basemap to the Oceans basemap. • Q2: Describe the ocean floor. Does the ocean floor look like you expected it to look? Why or why not? How does your understanding of plate tectonics help interpret the topography of the ocean floor? How does analyzing the ocean floor help understand the Hawaiian hot spot? Provide screenshots to support your answers. The ocean floor looks bumpy and rocky. Not really what I was expecting to see because you would think it would just be smooth since in pictures there is always sand. Plate tectonics are what move and produce little volcanoes all throughout the ocean floor. It is hard to imagine an earth without this since this is all we know. Hawaii consists of a volcano and this picture helps you see that it is bulged up just like a volcano. Do some research on the three deepest trenches. • Q3: What are trenches? What are their names? Investigate them in ArcGIS Online, identifying their location, using the measure tool to measure their length, and examining the depth readings to determine their depth. Provide screenshots to support your answers. Trenches are basically long narrow ditches. 1) The Mariana Trench, 11.0 km, 6.83 mi, pacific ocean near japan 2) The Philippine Trench, 10.4 km, 6.46 mi, pacific ocean near Philippines 3) Bonin Trench, 9.99 km, 6.20 mi, pacific ocean near japan Do some research on three seamounts. • Q4: What are seamounts? What are their names? Investigate them in ArcGIS Online, identifying their location, using the measure tool to measure their length, and examining the depth readings to determine their depth. Seamounts are basically a submarine mountain. 1) Graham, Sicily, 6 m, 63 m 2) Muirfield Seamount, 16-18 m, 5,000 m 3) Bear seamount, atlantic ocean, 1,100 m, 2,000 m Do some research and answer the following question: • Q5: Name three threats to ocean life, water quality, coral reefs, or threats to any other component of in the ocean. Three threats are: acidification, increase in water temperature, and over fishing. Natural Hazards We will now add additional spatial data layer to the map. You may need to either log into ArcGIS Online or click on Modify Map on the top right to add additional layers. Also, make sure the “Within map area” box is unchecked. Earthquakes and Volcanoes Click on the Add button and select “Search for Layers.” In the Find: box, type “global volcanoes.” Look for a layer titled USDOI Current global Natural Hazards and add it to your map. Make sure you basemap is still Oceans. Click on the Details button and then click on the USDOI Current Global Natural Hazards layer. Uncheck all the boxes other than U.S. Volcanoes and Other Volcanoes. • Q6: What pattern do you notice? How do volcanoes occur in the oceans? What are some famous islands that are volcanoes? What oceans and seas contain the most volcanoes? Which volcanoes on islands are the most active? There are many volcanoes all around the world and it is especially apparent with a picture of the ocean. Volcanoes occur within the oceans due to plate tectonics/ring of fire. Some famous islands that are volcanoes are Japan, Hawaii and the Philippines. The most active volcano lies in Hawaii. Most of the volcanoes occur in the pacific ocean. Uncheck all of the volcano layers and turn on the Earthquakes layer. Try searching for a spatial file in ArcGIS Online on tectonic plates. Add that to your map. • Q7: What pattern of earthquakes do you notice? What is the pattern of plate boundaries? Through which oceans do plate boundaries run? How do earthquakes occur in the ocean? Which plate boundaries are most active in terms of earthquakes in the oceans? Plate boundaries run through each of the oceans, earthquakes are everywhere and surround just about everything in the ocean. They sort of outline each of the countries. The pacific ring of fire is the most active boundary known today. These earthquakes occur along the oceanic and continental plates either converging, diverging or transforming. • Q8: What is the relationship between plate boundaries and earthquakes? What is the hazard associated with earthquakes in the oceans? Hurricanes and Weather Do a new search for Hurricanes in ArcGIS Online. Search for a file titled Hurricane Recent and add it to your map. Do another search for Generalized Ocean Currents. Look for a file called Generalized_Ocean_Currents and also add this to the map. • Plate boundaries will wither converge, diverge or transform as mentioned above. When this occurs that is how volcanic islands, faults, and the ring of fire forms. Earthquakes lead to hurricanes and other natural disasters occurring in the ocean due to the sudden movement in the water. • Q9: What is the relationship of hurricanes to oceans? What relationship is there between ocean currents and hurricane paths? How do oceans help foster and grow hurricanes? Next, let us consider the relationship of current weather to oceans. Watch the following video on weather differences in one day along the Atlantic Ocean. http://youtu.be/ 1a6govm2TAY What are two differences that you notice between the first day shown in the movie, and the second day. Add a new layer to your map by searching for Weather Stations. Look for a file titled NOAA Infrared Satellite and another layer titled NOAA GOES Satellite Imagery (Visible) and add them to your map. Do another search for NOAA Radar and look for a file titled Nexrad Live, which is a form of radar used for weather forecasting. • Ocean temperature are interrelated. They essentially determine what the hurricane is going to be like and also hurricanes obviously occur within the ocean. The climate change aids in fostering the development of a hurricane. The two days are a perfect example of the weather. The first day is semi strong winds, but still getting ready for the big ones that came the second day. It was also darker the second day and more powerful/scary. • Q10: How does current weather affect ocean chemistry, wave height, and temperature? How do oceans influence current weather? Name three ways that oceans influence longterm climate. Major Cities Along Coastlines Search for a new layer by typing Major Cities in the Find: box. Look for a layer titled CitiesLargeWorld and add it to the map. In ArcGIS Online, examine cities along coastlines. Find and name five major cities along coastlines. • • Current weather is constantly changing and I guess one could say this is due to climate change which leads to the ocean having an increase in water temperature, the acidification could be occurring and rain could be causing oceans to gain in height and be too full. 1) oceans store heat 2) constantly being moved by powerful currents 3) covers more than 70% of the world’s surface 1)Honolulu, Hawaii 2) Barcelona, Spain 3) Cape Town, South Africa 4) Miami Beach, Florida 5) Rio De Janeiro, Brazil Q11: Name three ways that the ocean affects the shore. What percentage of major world cities lies along coastlines? What threats do cities pose to ocean life? Name at least three natural hazards that exist to cities along coastlines? Over 40% of the population lives near a coastline. Cities make are a threat to oceans because of the easy access those have to cause harm to it. They can overfish, empty their trash in there or even their plastic killing many animals. 1) leaves stuff from ocean on the shore 2) modifies existing shorelines 3) global wind 1) storms, flooding, erosion 2) pollution 3) climate change Personal Exploration • Q12: You have explored a few aspects of oceans from a spatial perspective, but much more could be done. Write your own question about oceans, investigate it, and answer it! What color becomes less visible in the deepness that is the coral reef?? RED Reflection • Name three things you have learned about oceans through any of the above investigations. • Name three things you have learned about GIS through these investigations. • How has the spatial perspective about oceans influenced your understanding of it? 1) The world is a big place, even bigger than I knew. There is a lot that goes into keeping the earth clean and we should take part in that. 2) A lot of water goes to waste, yet there is still so much ocean life left. This does not mean that we can put this water to use as those around it harshly abuse it. 3) Oceans provide a way of living for those around yet they can also ruin a city in just one swoop of a hurricane or tsunami. The ocean is very powerful. 1) GIS is a difficult program and takes some time getting used to – I think anyway. 2) GIS provides a way for one to see one thing at a time or multiple things at once which is very helpful 3) GIS helps you investigate all that you need to know about volcanoes, plate tectonics, oceans and more. This has influenced my understanding a lot because I now am aware of how much oceans really do provide for us all around. Biodiversity is important and so are oceans. This spatial aspect of it helped me gain a better understanding of the world I live in and how to discover certain areas of the world as well.
