To determine the presence of PBDEs in local fishes using Gas
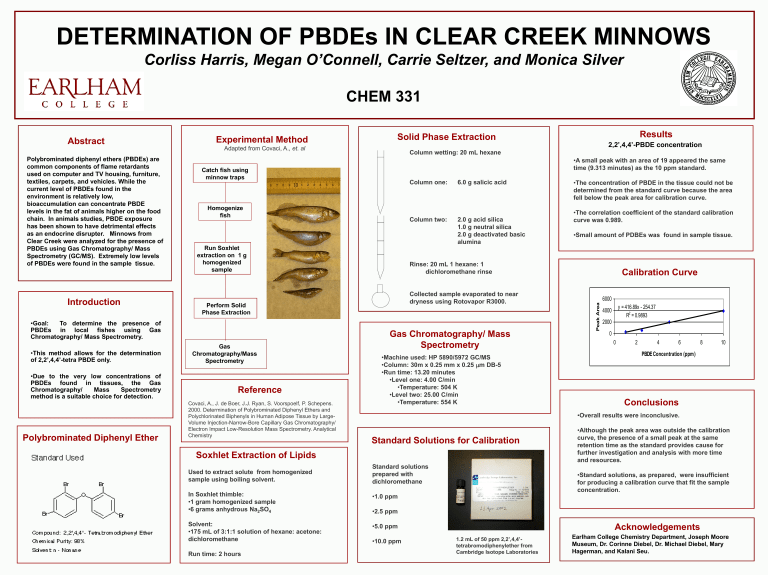
DETERMINATION OF PBDEs IN CLEAR CREEK MINNOWS
Corliss Harris, Megan O’Connell, Carrie Seltzer, and Monica Silver
CHEM 331
Abstract
Polybrominated diphenyl ethers (PBDEs) are common components of flame retardants used on computer and TV housing, furniture, textiles, carpets, and vehicles. While the current level of PBDEs found in the environment is relatively low, bioaccumulation can concentrate PBDE levels in the fat of animals higher on the food chain. In animals studies, PBDE exposure has been shown to have detrimental effects as an endocrine disrupter. Minnows from
Clear Creek were analyzed for the presence of
PBDEs using Gas Chromatography/ Mass
Spectrometry (GC/MS). Extremely low levels of PBDEs were found in the sample tissue.
Introduction
• Goal: To determine the presence of
PBDEs in local fishes using Gas
Chromatography/ Mass Spectrometry.
• This method allows for the determination of 2,2 ’,4,4’-tetra PBDE only.
• Due to the very low concentrations of
PBDEs found in tissues, the Gas
Chromatography/ Mass Spectrometry method is a suitable choice for detection.
Polybrominated Diphenyl Ether
Experimental Method
Adapted from Covaci, A., et. al
Catch fish using minnow traps
Homogenize fish
Run Soxhlet extraction on 1 g homogenized sample
Perform Solid
Phase Extraction
Gas
Chromatography/Mass
Spectrometry
Reference
Covaci, A., J. de Boer, J.J. Ryan, S. Voorspoelf, P. Schepens.
2000. Determination of Polybrominated Diphenyl Ethers and
Polychlorinated Biphenyls in Human Adipose Tissue by Large-
Volume Injection-Narrow-Bore Capillary Gas Chromatography/
Electron Impact Low-Resolution Mass Spectrometry. Analytical
Chemistry
Soxhlet Extraction of Lipids
Used to extract solute from homogenized sample using boiling solvent.
In Soxhlet thimble:
• 1 gram homogenized sample
• 6 grams anhydrous Na
2
SO
4
Solvent:
• 175 mL of 3:1:1 solution of hexane: acetone: dichloromethane
Run time: 2 hours
Solid Phase Extraction
Column wetting: 20 mL hexane
Column one: 6.0 g salicic acid
Column two: 2.0 g acid silica
1.0 g neutral silica
2.0 g deactivated basic alumina
Rinse: 20 mL 1 hexane: 1 dichloromethane rinse
Collected sample evaporated to near dryness using Rotovapor R3000.
Gas Chromatography/ Mass
Spectrometry
• Machine used: HP 5890/5972 GC/MS
• Column: 30m x 0.25 mm x 0.25 m m DB-5
• Run time: 13.20 minutes
• Level one: 4.00 C/min
• Temperature: 504 K
• Level two: 25.00 C/min
• Temperature: 554 K
Standard Solutions for Calibration
Standard solutions prepared with dichloromethane
• 1.0 ppm
• 2.5 ppm
• 5.0 ppm
• 10.0 ppm
1.2 mL of 50 ppm 2,2’,4,4’tetrabromodiphenylether from
Cambridge Isotope Laboratories
Results
2,2’,4,4’-PBDE concentration
• A small peak with an area of 19 appeared the same time (9.313 minutes) as the 10 ppm standard.
• The concentration of PBDE in the tissue could not be determined from the standard curve because the area fell below the peak area for calibration curve.
• The correlation coefficient of the standard calibration curve was 0.989.
• Small amount of PDBEs was found in sample tissue.
Calibration Curve
6000
4000
2000
0
0 y = 416.89x - 254.37
R
2
= 0.9893
2 4 6
PBDE Concentration (ppm)
8 10
Conclusions
• Overall results were inconclusive.
• Although the peak area was outside the calibration curve, the presence of a small peak at the same retention time as the standard provides cause for further investigation and analysis with more time and resources.
• Standard solutions, as prepared, were insufficient for producing a calibration curve that fit the sample concentration.
Acknowledgements
Earlham College Chemistry Department, Joseph Moore
Museum, Dr. Corinne Diebel, Dr. Michael Diebel, Mary
Hagerman, and Kalani Seu.
