Chapter 15
advertisement
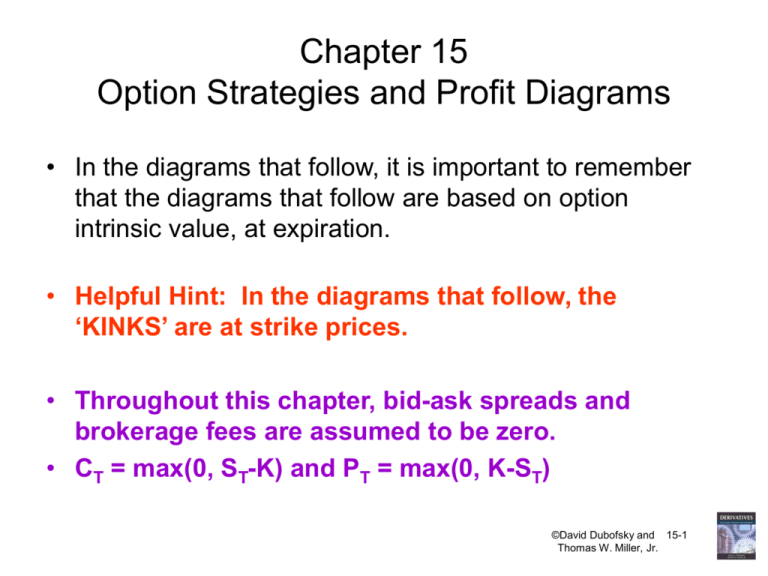
Chapter 15
Option Strategies and Profit Diagrams
• In the diagrams that follow, it is important to remember
that the diagrams that follow are based on option
intrinsic value, at expiration.
• Helpful Hint: In the diagrams that follow, the
‘KINKS’ are at strike prices.
• Throughout this chapter, bid-ask spreads and
brokerage fees are assumed to be zero.
• CT = max(0, ST-K) and PT = max(0, K-ST)
©David Dubofsky and 15-1
Thomas W. Miller, Jr.
Quick Quiz: Identify These Six Basic
Derivative Positions:
Profit
ST
[A]
[B]
[C]
[D]
[E]
[F]
©David Dubofsky and 15-2
Thomas W. Miller, Jr.
To These Six Basic Positions, add These
Two Riskless Positions
profit
ST
[A]
[B]
• Why are these positions riskless?
• What do they represent?
– Riskless Borrowing, [A], Receive money today, always pay
money at ‘expiration’ of the loan. (AKA: Short (sell) T-bills)
– Lending, [B], Pay money today, always receive money at
‘expiration’ of the loan. (AKA: Long (buy) T-bills)
©David Dubofsky and 15-3
Thomas W. Miller, Jr.
There are Three Basic Option
Trading Strategies
• Take a position in an option and the underlying.
• Take a position in 2 or more options of the same
type (This is called a spread)
– Same type means:
• Use only calls –or• Use only puts
• Take a position in a mixture of calls and puts
(This is called a combination.)
©David Dubofsky and 15-4
Thomas W. Miller, Jr.
Positions in an Option and the Underlying
•
•
Try to identify the positions in the option, the underlying, and the net position.
NB: The ‘KINKS’ occur at strike prices.
[A] Covered Call
[B]
[C] Protective Put
[D]
©David Dubofsky and 15-5
Thomas W. Miller, Jr.
How to construct a profit table
• Begin by computing the initial outlay, CF0.
• Choose a range of day T prices for the underlying asset
(begin at ~$2 below the lowest strike price and end at ~$2
above the highest strike price)
• Compute the expiration day payoffs for each position if
they are offset on day T
• Add up the expiration day payoffs from offsetting each
position; this gives you CFT.
• Add CFT to the initial outlay, CF0, and you will have
computed the strategy profit for each relevant value of ST.
©David Dubofsky and 15-6
Thomas W. Miller, Jr.
Example: Protective Put, I.
•
•
•
•
•
Suppose you current own 100 shares of a stock, with a value of $86.38/share.
You fear it may fall in value in the short run, but do not want to sell now.
You see the following option data:
Strike
Call
Put
75
80
85
90
95
11.50
7.00
4.25
2.25
0.81
0.75
1.38
3.25
6.13
8.88
You decide to purchase an 85 put.
The protective put strategy is long stock + long put.
©David Dubofsky and 15-7
Thomas W. Miller, Jr.
Example: Protective Put, II
• That is:
At time 0
Buy stock
Buy put
CF(0)
-86.38
- 3.25
-89.63
Stock
Price at P(T)
Sell
Expiration 85 Put stock
This is the
range of
S(T) that
you really
need
{
78.00
79.00
80.00
81.00
81.75
82.00
83.00
84.00
85.00
86.00
86.38
87.00
88.00
89.25
89.63
90.00
91.00
92.00
7.00
6.00
5.00
4.00
3.25
3.00
2.00
1.00
0.00
0.00
0.00
0.00
0.00
0.00
0.00
0.00
0.00
0.00
78.00
79.00
80.00
81.00
81.75
82.00
83.00
84.00
85.00
86.00
86.38
87.00
88.00
89.25
89.63
90.00
91.00
92.00
CF(T)
CF(0)+CF(T)
Portfolio
CF(0)
Profit
85.00
85.00
85.00
85.00
85.00
85.00
85.00
85.00
85.00
86.00
86.38
87.00
88.00
89.25
89.63
90.00
91.00
92.00
-89.63
-89.63
-89.63
-89.63
-89.63
-89.63
-89.63
-89.63
-89.63
-89.63
-89.63
-89.63
-89.63
-89.63
-89.63
-89.63
-89.63
-89.63
(4.63)
(4.63)
(4.63)
(4.63)
(4.63)
(4.63)
(4.63)
(4.63)
(4.63)
(3.63)
(3.25)
(2.63)
(1.63)
(0.38)
0.00
0.37
1.37
2.37
©David Dubofsky and 15-8
Thomas W. Miller, Jr.
Then, One Can Plot the Constituent
Profits and the Portfolio Profits
Example: Protective Put
10
Long 85 Put
Portfolio Profit
8
Long Stock
6
Portfolio Profit
4
2
0
-2
-4
-6
-8
-10
77
79
81
83
85
87
89
91
93
95
Stock Price at Expiration
©David Dubofsky and 15-9
Thomas W. Miller, Jr.
Writing a covered call
• Buy a stock for S(0) = 43
• Sell a call with K = 45 for C(0) = 1
• Initial outlay is -42
profit
Stock offset
Price at
C(T)
Expiration 45 call
40.00
41.00
42.00
43.00
44.00
45.00
46.00
47.00
48.00
0.00
0.00
0.00
0.00
0.00
0.00
-1.00
-2.00
-3.00
Sell
stock
CF(T)
CF(0)+CF(T)
Portfolio
CF(0)
Profit
40.00
41.00
42.00
43.00
44.00
45.00
46.00
47.00
48.00
40.00
41.00
42.00
43.00
44.00
45.00
45.00
45.00
45.00
-42.00
-42.00
-42.00
-42.00
-42.00
-42.00
-42.00
-42.00
-42.00
(2.00)
(1.00)
0.00
1.00
2.00
3.00
3.00
3.00
3.00
+3
42
45
ST
©David Dubofsky and 15-10
Thomas W. Miller, Jr.
Vertical Spreads, I.
• [A] Bullish Vertical Spread with Calls (AKA: A Bull Call Spread,
or a bullish call money spread).
– Buy Call with lower strike.
– Sell Call with higher strike.
Profit
St
Note that there is an initial
outlay with this strategy; the
purchased call has a higher
price than the written call
[A] Bull Call Spread
Identify the Strike Prices
Using the ‘kinks’
©David Dubofsky and 15-11
Thomas W. Miller, Jr.
Vertical Spreads, II.
• [B] Bullish Vertical Spread with Puts (AKA: A Bull Put Spread.)
– Buy Put with lower strike.
– Sell Put with higher strike.
Profit
St
There is an initial
cash inflow with this
strategy.
[B] Bull Put Spread
Again: Identify the Strikes by the
‘Kinks’. Do they make sense?
©David Dubofsky and 15-12
Thomas W. Miller, Jr.
Vertical Spreads, III.
• [C] Bearish Vertical Spread with Calls (AKA: A Bear Call Spread.)
– Buy call with higher strike.
– Sell call with lower strike.
Profit
St
Is there an initial
cash inflow or
outflow?
[C] Bear Call Spread
©David Dubofsky and 15-13
Thomas W. Miller, Jr.
Vertical Spreads, IV.
• [D] Bearish Vertical Spread with Puts (AKA: A Bear Put Spread.)
– Buy put with higher strike.
– Sell put with lower strike.
Profit
St
Is there an initial cash
inflow or cash outflow?
[D] Bear Put Spread
©David Dubofsky and 15-14
Thomas W. Miller, Jr.
Example: Bullish Vertical
Spread with Calls, I.
•
Suppose you observe the following data from the CBOE:
– Price of Jan 80 Call: $3.75 ($375 per contract)
– Price of Jan 75 Call: $5.00 ($500 per contract)
•
•
•
You decide to buy the Jan 75 call and sell the Jan 80 Call.
Today, your outlay is $1.25, or $125 per contract.
At expiration:
– At any price lower than $75, your payoff is $0 and your loss is $1.25 (your initial
outlay).
– If the underlying price is $76 at expiration, your payoff is $1.00, and your loss (CF0 +
CFT) is $0.25.
– If the underlying price is $77 at expiration, your payoff is $2.00, and your profit is
$0.75.
– If the underlying price is $79 at expiration, your payoff is $4.00, and your profit is
$2.75.
– At any price equal to or above $80, your payoff is $5.00, or $500, and your profit is
3.75.
©David Dubofsky and 15-15
Thomas W. Miller, Jr.
Example: Bullish Vertical
Spread with Calls, II.
• Today:
Buy Jan 75 call -5
Sell Jan 80 call +3.75
CF(0)
-1.25
ST
C(T)
Offset
75 Call
C(T)
offset
80 Call
CF(T)
Total
Profit
CF(0)+CF(T)
73
74
75
76
77
78
79
80
81
82
83
84
85
0.00
0.00
0.00
1.00
2.00
3.00
4.00
5.00
6.00
7.00
8.00
9.00
10.00
0.00
0.00
0.00
0.00
0.00
0.00
0.00
0.00
(1.00)
(2.00)
(3.00)
(4.00)
(5.00)
0.00
0.00
0.00
1.00
2.00
3.00
4.00
5.00
5.00
5.00
5.00
5.00
5.00
(1.25)
(1.25)
(1.25)
(0.25)
0.75
1.75
2.75
3.75
3.75
3.75
3.75
3.75
3.75
©David Dubofsky and 15-16
Thomas W. Miller, Jr.
Example: Bullish Vertical
Spread with Calls, III.
Then, one can plot the underlying price at expiration against the position
profit or loss (note that the kinks are at the strike prices, 75 and 80):
(Obviously, one could plot each elementary position as well.)
Bullish Vertical Spread with Calls
Profit/Loss
3.75
2.75
1.75
0.75
-0.25
-1.25
73
74
75
76
77
78
79
80
81
82
83
84
85
Underlying Price at Expiration
©David Dubofsky and 15-17
Thomas W. Miller, Jr.
Butterfly Spread Using Calls
• This is a Long Call Butterfly: With equally spaced strikes:
Profit
ST
Long 1 with lowest strike;
Short 2 with middle strike;
Long 1 with highest strike
Long Butterfly Using Calls
©David Dubofsky and 15-18
Thomas W. Miller, Jr.
Butterfly Spread Using Puts
• This is a Long Put Butterfly: With equally spaced strikes:
Long 1 with lowest strike;
Short 2 with middle strike;
Long 1 with highest strike
Long Butterfly Using Puts
What do you think a written butterfly
would look like?
©David Dubofsky and 15-19
Thomas W. Miller, Jr.
Other Spreads, I.
• Calendar Spreads:
– Use the same strike, but with two different expiration dates.
– Can use either calls or puts.
– The resulting payoff is curved. This is because one option is still
‘alive’ at the expiration date of the other.
• Ratio Spreads (pg. 430)
– Can use either calls or puts.
– Same expiration, but with two different strikes.
– However, unlike other spreads, the number of options held in
each position is not the same. For example, a one could buy 3
puts with a strike of 30, and sell one put with a strike of 35.
©David Dubofsky and 15-20
Thomas W. Miller, Jr.
Other Spreads, II.
• Condor Spread.
– Uses four, equally spaced strikes.
– For a long condor spread: Long 1 at the lowest and 1 at the
highest strike; short 1 at both intervening strikes.
– The resulting payoff resembles a butterfly spread, but with a
‘flat spot’ between the middle two strikes. (The payoff for a
long butterfly resembles a ‘witches’ hat; the payoff for a long
condor resembles a ‘stovepipe’ hat.)
©David Dubofsky and 15-21
Thomas W. Miller, Jr.
Other Spreads, III.
• Box ‘Spread’ (Really, these are combinations)
– Use two equally spaced strikes, K1 and K2, where K1 < K2.
– Long Box: Long a call with strike K1; Long a put with strike K2.
Short a call with strike K2; Short a put with strike K1.
– A Long Box costs money today, but always has a value of K2 – K1
at expiration. Therefore, a long box resembles riskless lending,
I.e., long T-bill.
– A Short Box is formed by reversing all the positions in a long box.
As a result, a short box generates a cash inflow today, but has a
value of –(K2 – K1) at expiration. Therefore, a short box resembles
riskless borrowing, I.e., short T-bill.
©David Dubofsky and 15-22
Thomas W. Miller, Jr.
Combinations, I.
• A Long Straddle is formed by a long call and a long put:
– Both have the same strike and expiration date.
– What is the worst possible value for the underlying at expiration?
– In a Short Straddle, one sells the call and sells the put.
Profit
ST
Long Straddle Using a Call and a Put
©David Dubofsky and 15-23
Thomas W. Miller, Jr.
Combinations, II.
• A Long Strangle is formed by a long call and a long put:
– Both have the same expiration date.
– But, the call and put have different strike prices.
– In a Short Strangle, one sells the call and sells the put.
(what does it look like?)
Profit
ST
Long Strangle Using a Call and a Put
©David Dubofsky and 15-24
Thomas W. Miller, Jr.
Combinations, III.
Strips and Straps
• Strips and straps are formed by using a different number of calls and
puts. However, all the options share
– The same strike price.
– The same expiration date.
Long 1 Call; Long 2 Puts
[A] Long Strip
What are the slopes of these lines?
Long 1 Put; Long 2 Calls
[B] Long Strap
©David Dubofsky and 15-25
Thomas W. Miller, Jr.
Example: Long 85 Straddle
• You see the following option data and decide to purchase an 85 call
and an 85 put.
Strike
Call
Put
75
80
85
90
95
11.50
7.00
4.25
2.25
0.81
0.75
1.38
3.25
6.13
8.88
• Using the steps to build a profit table, you construct the following
table.
©David Dubofsky and 15-26
Thomas W. Miller, Jr.
Long 85 Straddle, II.
Stock
Offset Offset
Price at
P(T)
C(T)
Expiration 85 Put 85 Call
Time 0
Buy C (K=85)
-4.25
Buy P (K=85)
-3.25
CF(0)
-7.50
75.00
76.00
77.00
78.00
79.00
80.00
81.00
81.75
82.00
83.00
84.00
85.00
86.00
86.38
87.00
88.00
89.25
89.63
90.00
91.00
92.00
92.50
93.00
94.00
95.00
10.00
9.00
8.00
7.00
6.00
5.00
4.00
3.25
3.00
2.00
1.00
0.00
0.00
0.00
0.00
0.00
0.00
0.00
0.00
0.00
0.00
0.00
0.00
0.00
0.00
0.00
0.00
0.00
0.00
0.00
0.00
0.00
0.00
0.00
0.00
0.00
0.00
1.00
1.38
2.00
3.00
4.25
4.63
5.00
6.00
7.00
7.50
8.00
9.00
10.00
CF(T)
CF(0)
Portfolio
Profit
10.00
9.00
8.00
7.00
6.00
5.00
4.00
3.25
3.00
2.00
1.00
0.00
1.00
1.38
2.00
3.00
4.25
4.63
5.00
6.00
7.00
7.50
8.00
9.00
10.00
(7.50)
(7.50)
(7.50)
(7.50)
(7.50)
(7.50)
(7.50)
(7.50)
(7.50)
(7.50)
(7.50)
(7.50)
(7.50)
(7.50)
(7.50)
(7.50)
(7.50)
(7.50)
(7.50)
(7.50)
(7.50)
(7.50)
(7.50)
(7.50)
(7.50)
2.50
1.50
0.50
(0.50)
(1.50)
(2.50)
(3.50)
(4.25)
(4.50)
(5.50)
(6.50)
(7.50)
(6.50)
(6.12)
(5.50)
(4.50)
(3.25)
(2.87)
(2.50)
(1.50)
(0.50)
0.00
0.50
1.50
2.50
©David Dubofsky and 15-27
Thomas W. Miller, Jr.
Long 85 Straddle, III.
Then, one can plot the profit data:
Example: Long 85 Straddle
10.00
Long 85 Put
7.50
Long 85 Call
Position Profit
Profit
5.00
2.50
0.00
-2.50
-5.00
-7.50
-10.00
70
75
80
85
90
95
100
Stock Price at Expiration
©David Dubofsky and 15-28
Thomas W. Miller, Jr.
Profit Diagrams for Positions Offset Prior to
the Expiration Day
• Any strategy can be offset prior to expiration.
• To prepare a profit diagram (as a function of the price of
the underlying asset on a given day prior to T), you must
estimate the value of the options. For this, you need an
option pricing model. You also have to guess what
implied volatility (σ) will exist in the option prices on that
day.
• See pg. 434 for diagrams depicting how a bullish money
spread and a long straddle evolve over time.
©David Dubofsky and 15-29
Thomas W. Miller, Jr.
Expectations of Students
• You should know what the following strategies are, and
what their profit diagrams look like:
–
–
–
–
–
Long stock, short stock
Long call, short call, long put, short put
Covered call, protective put
Bullish money spread and bearish money spread
Long and short straddle and strangle
• BUT…I can give you any melange of elementary
positions, and you should be able to prepare a profit
table. See, for example, problem 15.10.
©David Dubofsky and 15-30
Thomas W. Miller, Jr.
