8A2 & 8A4 Parents: Scatterplots
advertisement
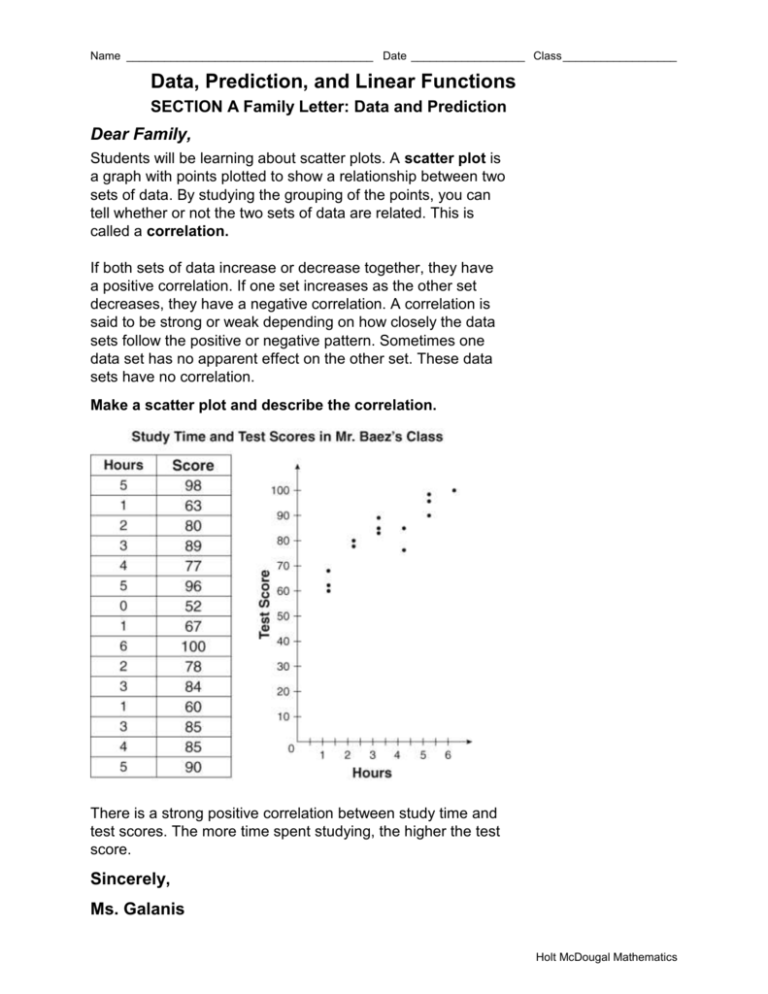
Name _______________________________________ Date __________________ Class __________________ Data, Prediction, and Linear Functions SECTION A Family Letter: Data and Prediction Dear Family, Students will be learning about scatter plots. A scatter plot is a graph with points plotted to show a relationship between two sets of data. By studying the grouping of the points, you can tell whether or not the two sets of data are related. This is called a correlation. If both sets of data increase or decrease together, they have a positive correlation. If one set increases as the other set decreases, they have a negative correlation. A correlation is said to be strong or weak depending on how closely the data sets follow the positive or negative pattern. Sometimes one data set has no apparent effect on the other set. These data sets have no correlation. Make a scatter plot and describe the correlation. There is a strong positive correlation between study time and test scores. The more time spent studying, the higher the test score. Sincerely, Ms. Galanis Holt McDougal Mathematics Name _______________________________________ Date __________________ Class __________________ Data, Prediction, and Linear Functions SECTION A Family Letter: Data and Prediction continued Students will also learn about lines of best fit. When you draw a line on a scatter plot so that it comes closest to most of the points on the scatter plot, you have found a line of best fit. On the graph shown below, the points are the scatter plot and the line is a linear best fit model. This line is used to make predictions about the relationship of the data. The predictions are usually made about points that might be part of the scatter plot if the x- and y- scales were extended. With any line of best fit, some points lie above the line, some lie below the line and some line on line. The more points that lie on the line, the more closely the line of best fit models the data of the scatter plot. Holt McDougal Mathematics Name _______________________________________ Date __________________ Class __________________ Data, Prediction, and Linear Functions SECTION A At-Home Practice: Data and Prediction 1. A group of students had babysitting jobs over the weekend. Use the given data to make a scatter plot. Name Total Hours Worked Amount Earned Sheri 5 $22.50 Jordan 8 $36.00 Lydia 11 $49.50 Alexis 6 $27.00 2. Use the data from the scatter plot to predict the number of hours Sam would have to work to make $30. ________________________________________________________________________________________ Do the sets of data have a positive, negative, or no correlation? 3. The weight of a baby and the month that it is born. 4. The amount of free time you have and the number of sports that you play. ________________________________________ _______________________________________ Use the scatter plot to answer questions 5-8. A car manufacturer tracks the value of a certain model of car over time as shown in the scatter plot below. 25000 y 22500 20000 Car Value 17500 15000 12500 10000 7500 5000 2500 1 2 3 4 5 6 7 8 9 x Age (years) 5. Does the pattern of association between car value and age appear to be linear or non-linear? 6. Identify any outliers. 7. Is the correlation positive or negative? 8. Predict the sales price when the age is 10 years old. Answers: 1. Points should be plotted at: (5, 22.50), (8, 36), (11, 49.50) and (6, 27): x-axis is hours worked, y-axis is amount earned 2. about 7 hours 3. no correlation 4. negative correlation 5. non-linear 6. (5, 10,000) 7. negative 8. about $2,500 Holt McDougal Mathematics Name _______________________________________ Date __________________ Class __________________ Data, Prediction, and Linear Functions Family Fun: Graphing for Greatness Unscramble the words below. Then look through the chapter to find examples of each. Try to find at least two examples and write the page numbers on which they appear. 1. T A C P O T S R L E T ___________________________________________________ Examples on pages ________________________________________________________ 2. F E I I S E N F B T O L T ________________________________________________ Examples on pages ________________________________________________________ 3. T S E R L C N U G I _____________________________________________________ Examples on pages ________________________________________________________ 4. R P S O E C O R T L V I E I A N O I T ____________________________________ Examples on pages ________________________________________________________ 5. W T A T W Y O L E B A _________________________________________________ Examples on pages ________________________________________________________ 6. R R N E I T C O O L A A T N G V E I _____________________________________ Examples on pages ________________________________________________________ Answers: 1. Scatterplot; 2. Line of best fit; 3. Clustering; 4. Positive correlation; 5. Two-way table; 6. Negative correlation Holt McDougal Mathematics

