L-3 Equation of the Line of Best Fit
advertisement
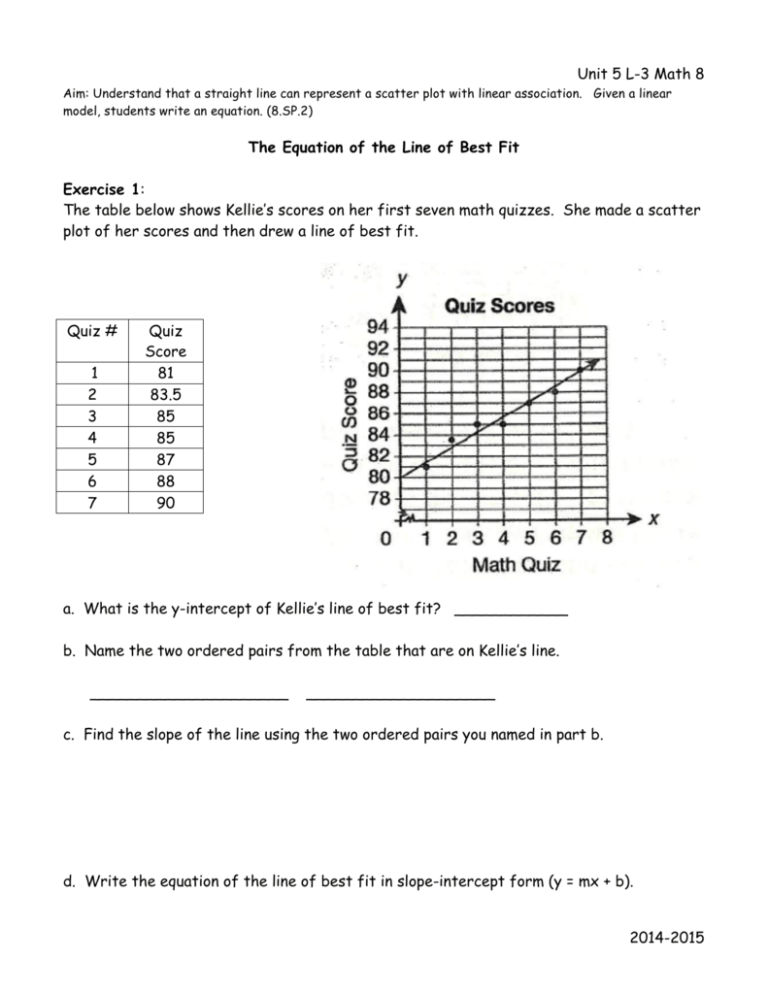
Unit 5 L-3 Math 8 Aim: Understand that a straight line can represent a scatter plot with linear association. Given a linear model, students write an equation. (8.SP.2) The Equation of the Line of Best Fit Exercise 1: The table below shows Kellie’s scores on her first seven math quizzes. She made a scatter plot of her scores and then drew a line of best fit. Quiz # 1 2 3 4 5 6 7 Quiz Score 81 83.5 85 85 87 88 90 a. What is the y-intercept of Kellie’s line of best fit? ____________ b. Name the two ordered pairs from the table that are on Kellie’s line. _____________________ ____________________ c. Find the slope of the line using the two ordered pairs you named in part b. d. Write the equation of the line of best fit in slope-intercept form (y = mx + b). 2014-2015 Exercise 2: Which equation most closely represents the line of best fit for the scatter plot at the right? ! (b) y = !x + 1 ! ! (d) y = !x + 1 (a) y = !x ! (c) y = ! x + 4 Exercise 3: A scatter plot was constructed on the graph below and a line of best fit was drawn. What is the equation of the line of best fit? Exercise 4: The scatter plot below shows the profit, by month, for a new company for the first year of operation. Kate drew a line of best fit, as shown in the diagram. What is the equation of the line of best fit? ! (a) y = !x - 2 ! (b) y = !x - 2 ! (c) y = !x ! (d) y = !x + 2 2014-2015 Exercise 5: Use the scatter plot and line of best fit to the right to answer the following questions. a. How many hours would a student have to study to get a score of 90? b. If a student studies for 30 hours, what will their test scores be? c. How many hours would a student have to study to get a score of 70? d. If a student studies for 15 hours, what will their test score be? Exercise 6: The scatter plot to the right shows the relationship between earnings and rank of Women’s Tennis players in 2001. a. Draw a line of best fit for the scatter plot. b. Kim says the equation of the line of best fit is y = -2x + 2. Is Kim’s equation a reasonable estimate of the line of best fit? 2014-2015 Exercise 7: The scatter plot to the right shows the salaries of engineers based on years of experience. a. What is the equation of the line of best fit? Show all work. b. Using the equation estimate the salary of an engineer that has 30 years of experience. c. Using the line of best fit, estimate the salary of an engineer that has 30 years of experience. d. Do your answers in part b and c match? Why or why not? e. Using the graph, estimate the years of experience an engineer would have that makes $85,000. 2014-2015
