Potential Energy Diagram & Table I Worksheet
advertisement
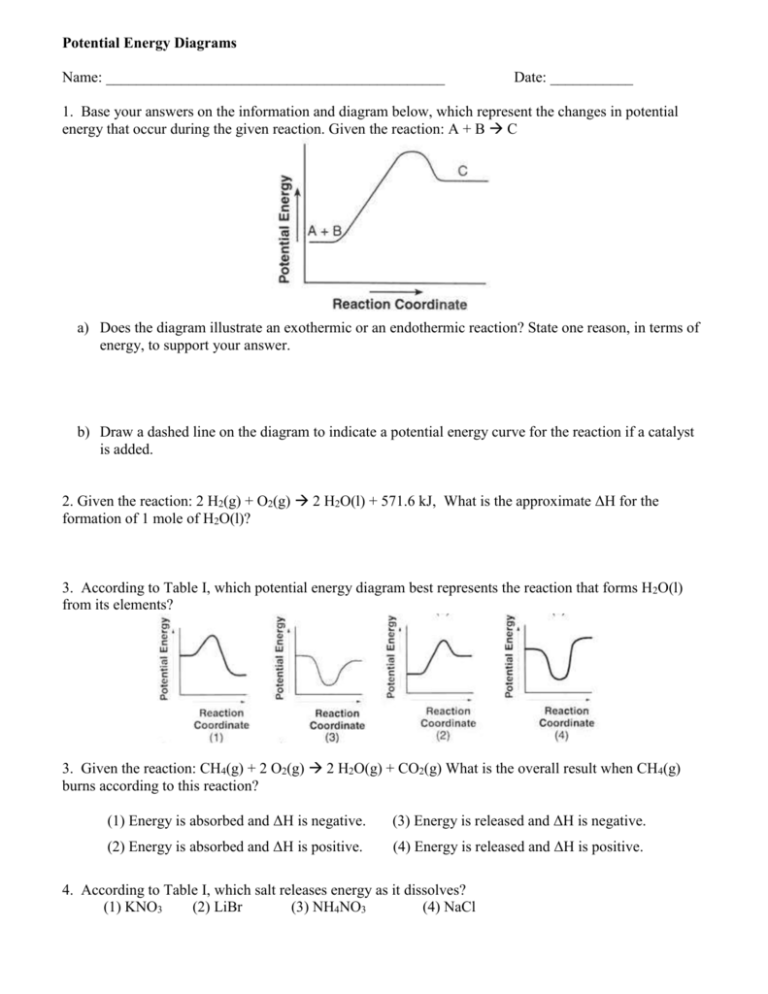
Potential Energy Diagrams Name: _____________________________________________ Date: ___________ 1. Base your answers on the information and diagram below, which represent the changes in potential energy that occur during the given reaction. Given the reaction: A + B C a) Does the diagram illustrate an exothermic or an endothermic reaction? State one reason, in terms of energy, to support your answer. b) Draw a dashed line on the diagram to indicate a potential energy curve for the reaction if a catalyst is added. 2. Given the reaction: 2 H2(g) + O2(g) 2 H2O(l) + 571.6 kJ, What is the approximate ΔH for the formation of 1 mole of H2O(l)? 3. According to Table I, which potential energy diagram best represents the reaction that forms H2O(l) from its elements? 3. Given the reaction: CH4(g) + 2 O2(g) 2 H2O(g) + CO2(g) What is the overall result when CH4(g) burns according to this reaction? (1) Energy is absorbed and ΔH is negative. (3) Energy is released and ΔH is negative. (2) Energy is absorbed and ΔH is positive. (4) Energy is released and ΔH is positive. 4. According to Table I, which salt releases energy as it dissolves? (1) KNO3 (2) LiBr (3) NH4NO3 (4) NaCl 5. Which statement correctly describes an endothermic chemical reaction? (1) The products have higher potential energy than the reactants, and the ΔH is negative. (2) The products have higher potential energy than the reactants, and the ΔH is positive. (3) The products have lower potential energy than the reactants, and the ΔH is negative. (4) The products have lower potential energy than the reactants, and the ΔH is positive. 6. The potential energy diagram below represents a chemical reaction: Which arrow represents the activation energy of the forward reaction? (1) A (2) B (3) C (4) D Base your answers to questions 7 through 9 on the information and potential energy diagram below. Chemical cold packs are often used to reduce swelling after an athletic injury. The diagram represents the potential energy changes when a cold pack is activated. 7. Which lettered interval on the diagram represents the potential energy of the products? _______ 8. Which lettered interval on the diagram represents the heat of reaction? ________ 9. Identify a reactant listed in Reference Table I that could be mixed with water for use in a chemical cold pack.
