st 3901 - statistical application in biological sc.
advertisement
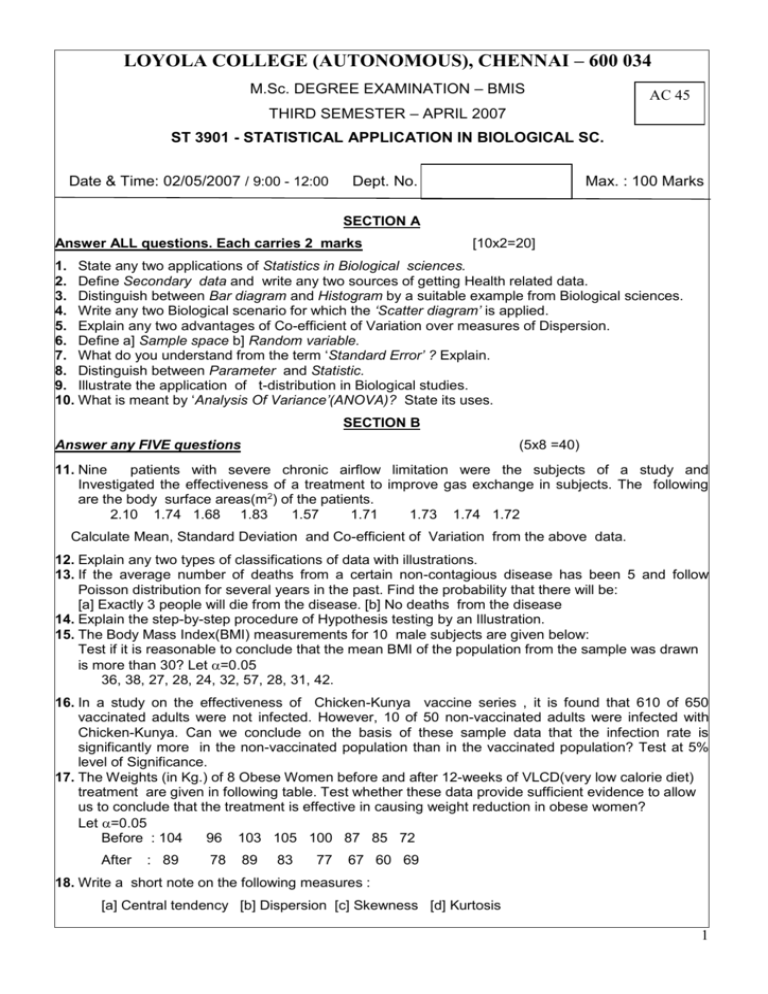
LOYOLA COLLEGE (AUTONOMOUS), CHENNAI – 600 034 M.Sc. DEGREE EXAMINATION – BMIS AC 45 THIRD SEMESTER – APRIL 2007 ST 3901 - STATISTICAL APPLICATION IN BIOLOGICAL SC. Date & Time: 02/05/2007 / 9:00 - 12:00 Dept. No. Max. : 100 Marks SECTION A Answer ALL questions. Each carries 2 marks [10x2=20] 1. State any two applications of Statistics in Biological sciences. 2. Define Secondary data and write any two sources of getting Health related data. 3. Distinguish between Bar diagram and Histogram by a suitable example from Biological sciences. 4. Write any two Biological scenario for which the ‘Scatter diagram’ is applied. 5. Explain any two advantages of Co-efficient of Variation over measures of Dispersion. 6. Define a] Sample space b] Random variable. 7. What do you understand from the term ‘Standard Error’ ? Explain. 8. Distinguish between Parameter and Statistic. 9. Illustrate the application of t-distribution in Biological studies. 10. What is meant by ‘Analysis Of Variance’(ANOVA)? State its uses. SECTION B Answer any FIVE questions (5x8 =40) 11. Nine patients with severe chronic airflow limitation were the subjects of a study and Investigated the effectiveness of a treatment to improve gas exchange in subjects. The following are the body surface areas(m2) of the patients. 2.10 1.74 1.68 1.83 1.57 1.71 1.73 1.74 1.72 Calculate Mean, Standard Deviation and Co-efficient of Variation from the above data. 12. Explain any two types of classifications of data with illustrations. 13. If the average number of deaths from a certain non-contagious disease has been 5 and follow Poisson distribution for several years in the past. Find the probability that there will be: [a] Exactly 3 people will die from the disease. [b] No deaths from the disease 14. Explain the step-by-step procedure of Hypothesis testing by an Illustration. 15. The Body Mass Index(BMI) measurements for 10 male subjects are given below: Test if it is reasonable to conclude that the mean BMI of the population from the sample was drawn is more than 30? Let =0.05 36, 38, 27, 28, 24, 32, 57, 28, 31, 42. 16. In a study on the effectiveness of Chicken-Kunya vaccine series , it is found that 610 of 650 vaccinated adults were not infected. However, 10 of 50 non-vaccinated adults were infected with Chicken-Kunya. Can we conclude on the basis of these sample data that the infection rate is significantly more in the non-vaccinated population than in the vaccinated population? Test at 5% level of Significance. 17. The Weights (in Kg.) of 8 Obese Women before and after 12-weeks of VLCD(very low calorie diet) treatment are given in following table. Test whether these data provide sufficient evidence to allow us to conclude that the treatment is effective in causing weight reduction in obese women? Let =0.05 Before : 104 96 103 105 100 87 85 72 After : 89 78 89 83 77 67 60 69 18. Write a short note on the following measures : [a] Central tendency [b] Dispersion [c] Skewness [d] Kurtosis 1 SECTION C Answer any TWO questions (2x20=40) 19. In a research study, Age and Blood Urea values were observed from 10 PKD patients. [a] Detect the nature of Correlation between Age and Blood urea level [b] Determine the co-efficient of Correlation between Age and Blood Urea. [c] Construct Regression equations and hence estimate the Blood Urea value when age is 57 Age 13 12 38 15 37 33 34 36 78 61 Blood Urea 24 31 45 31 42 32 38 38 43 32 20. Blood Sugar values were observed from 10 Normal and 10 PKD patients. [a] Identify which set of patients is having higher average Blood sugar level. [b] Find out the group which is more consistent with regard to Blood Sugar level [c] Also compute the co-efficients of Skewness and Kurtosis and hence comment on symmetry and Normality nature of the groups. Blood Sugar 130 155 185 98 120 106 125 96 110 90 180 125 162 140 162 130 108 145 190 125 (Normal) Blood Sugar (PKD) 21. [a] The following are measurements of Streptococcus Pneumonia bacteria in lungs ( log10 cfu / ml of lung homogenate) after 24 hours of injections of two types. Can we conclude that the injections are equally effective on the clearance of the viable bacteria? Test at 5% level of significance. Ofloxacin100 : 7.3 5.3 7.4 6.7 7.1 Ciprofloxacin100 : 7.8 4.6 6.4 8.0 7.2 [b] The following table gives the number of earthworms obtained from ten randomly located sampled plots of 1m2 area. Can we conclude that the earthworm population is distributed equally in all the plots? Plot number 1 2 3 4 5 6 7 8 9 10 No. of Earthworm / m2 25 32 17 23 15 39 27 19 22 26 22. A re-motivation team in a psychiatric hospital conducted an experiment to compare five methods for re-motivating patients. Patients were grouped according to level of initial motivation. Patients in each group were randomly assigned to the five methods. At the end of the experimental period the patients were evaluated by a team composed of a psychiatrist, a psychologist, a nurse and a social worker, none of whom was aware of the method to which patients had been assigned. The team assigned each patient a composite score as a measure of his/her level of motivation. The results were as follows: Level of Initial motivation Re-motivation method A B C D E Nil 58 68 60 68 64 Very Low 62 70 65 80 69 Low 67 78 68 81 70 Average 70 81 70 89 74 Do these data provide sufficient evidence to indicate a difference in mean scores among methods? Also, test whether the level of Initial motivation are equal? Let =0.05. *************** 2
