Lab – Atomic Emission Spectroscopy
advertisement
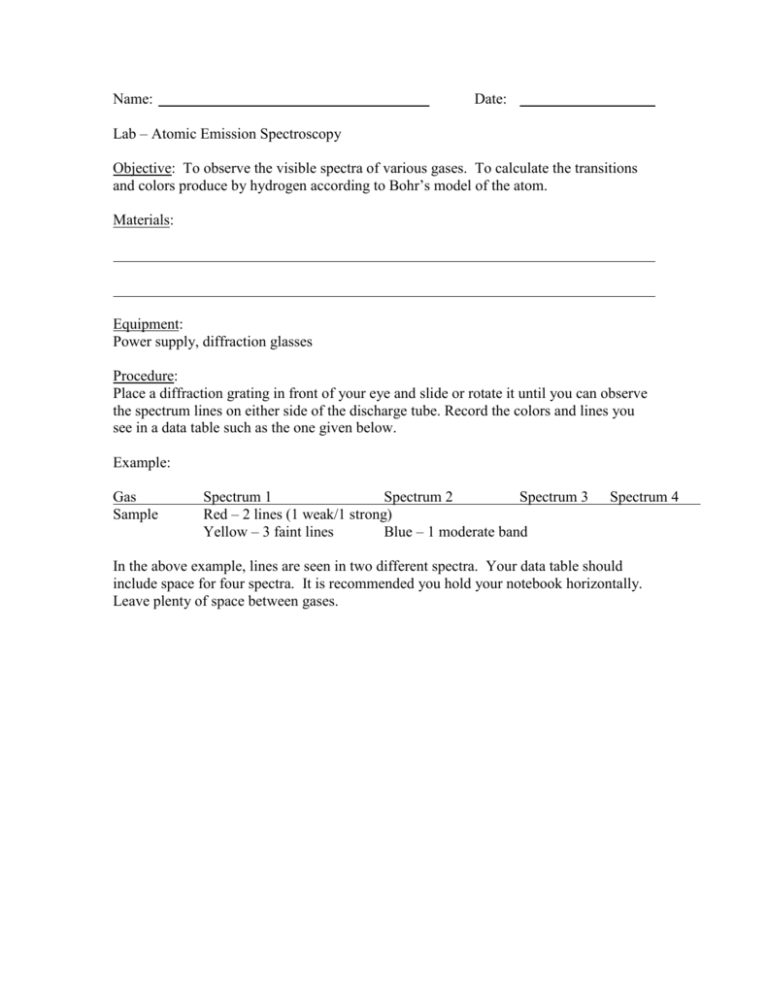
Name: Date: Lab – Atomic Emission Spectroscopy Objective: To observe the visible spectra of various gases. To calculate the transitions and colors produce by hydrogen according to Bohr’s model of the atom. Materials: Equipment: Power supply, diffraction glasses Procedure: Place a diffraction grating in front of your eye and slide or rotate it until you can observe the spectrum lines on either side of the discharge tube. Record the colors and lines you see in a data table such as the one given below. Example: Gas Sample Spectrum 1 Spectrum 2 Spectrum 3 Red – 2 lines (1 weak/1 strong) Yellow – 3 faint lines Blue – 1 moderate band Spectrum 4 In the above example, lines are seen in two different spectra. Your data table should include space for four spectra. It is recommended you hold your notebook horizontally. Leave plenty of space between gases. Analysis/Calculations: 1 1 R 2 2 to determine the wavelength of the light produced n f ni by each transition in a hydrogen atom (there are 21 total). R is the Rydberg constant. The variable ni represents the initial energy level (the level the electron started on), and nf is the final energy level (the level the electron falls to). Please remember to show all work. Remember that once you simplify the equation you will 1 find , not . Give your answers in nanometers. 1. Use the equation 1 2. Use the electromagnetic spectrum to match the color seen with its corresponding transition. For each series, give the category of emr (e.g. ultraviolet) to which it belongs. E 3. If R , calculate E (the energy needed to remove an electron from an atom) for ch hydrogen. 4. Label each group of transitions on your diagram. They are named after the people who studied them.


![Margit Haberreiter [], Laboratory for Atmospheric](http://s2.studylib.net/store/data/013086512_1-68e1f5c8efe978404d51647729788eb4-300x300.png)
