Cost Accounting Exercise: Flow of Inventoriable Costs
advertisement
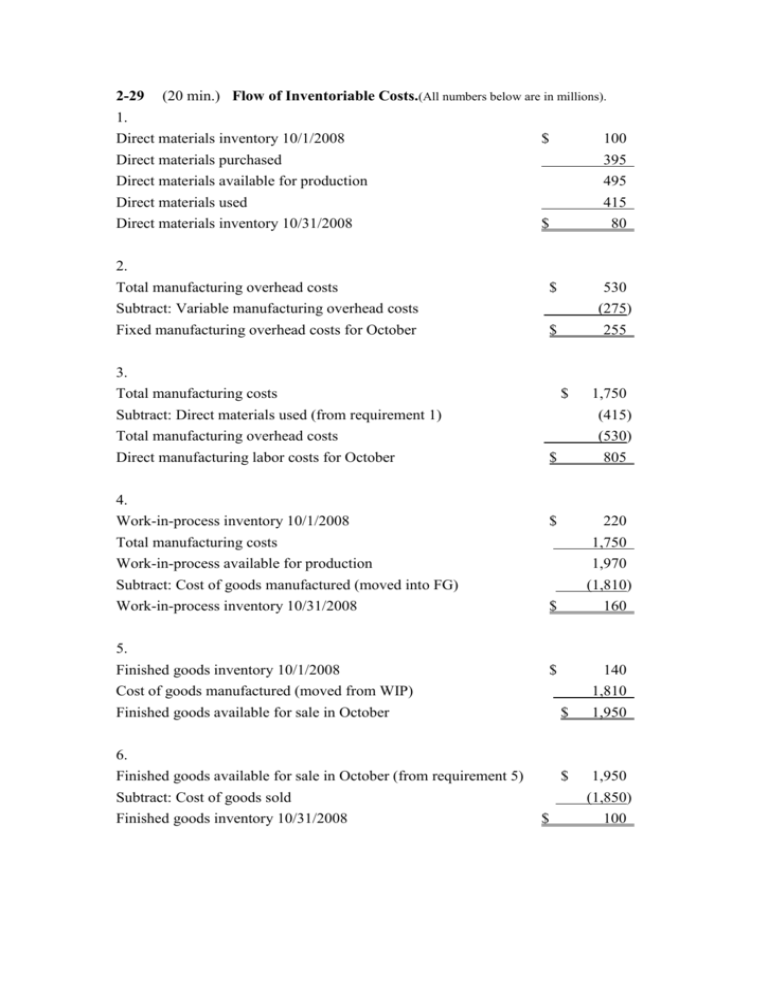
2-29 (20 min.) Flow of Inventoriable Costs.(All numbers below are in millions). 1. Direct materials inventory 10/1/2008 $ 100 Direct materials purchased 395 Direct materials available for production 495 Direct materials used 415 Direct materials inventory 10/31/2008 $ 80 2. Total manufacturing overhead costs Subtract: Variable manufacturing overhead costs $ 530 (275) Fixed manufacturing overhead costs for October $ 255 3. Total manufacturing costs Subtract: Direct materials used (from requirement 1) Total manufacturing overhead costs Direct manufacturing labor costs for October $ $ 1,750 (415) (530) 805 4. Work-in-process inventory 10/1/2008 $ 220 Total manufacturing costs Work-in-process available for production Subtract: Cost of goods manufactured (moved into FG) Work-in-process inventory 10/31/2008 $ 5. Finished goods inventory 10/1/2008 Cost of goods manufactured (moved from WIP) Finished goods available for sale in October 6. Finished goods available for sale in October (from requirement 5) Subtract: Cost of goods sold Finished goods inventory 10/31/2008 1,750 1,970 (1,810) 160 $ $ $ $ 140 1,810 1,950 1,950 (1,850) 100 2-30 (20 min.) Computing cost of goods purchased and cost of goods sold. (1) Marvin Department Store Schedule of Cost of Goods Purchased For the Year Ended December 31, 2008 (in thousands) Purchases $155,000 Add transportation-in 7,000 162,000 Deduct: Purchase return and allowances $4,000 Purchase discounts 6,000 10,000 Cost of goods purchased (2) $152,000 Marvin Department Store Schedule of Cost of Goods Sold For the Year Ended December 31, 2008 (in thousands) Beginning merchandise inventory 1/1/2008 $ 27,000 Cost of goods purchased (above) 152,000 Cost of goods available for sale 179,000 Ending merchandise inventory 12/31/2008 34,000 Cost of goods sold $145,000 2-32 (25–30 min.) Howell Corporation Income Statement for the Year Ended December 31, 2009 (in millions) Revenues Cost of goods sold: Beginning finished goods, Jan. 1, 2009 Cost of goods manufactured (below) Cost of goods available for sale Ending finished goods, Dec. 31, 2009 Gross margin Marketing, distribution, and customer-service costs Operating income $950 $ 70 645 715 55 660 290 240 $ 50 Howell Corporation Schedule of Cost of Goods Manufactured for the Year Ended December 31, 2009 (in millions) Direct materials costs: Beginning inventory, Jan. 1, 2009 $ 15 Purchases of direct materials 325 Cost of direct materials available for use 340 Ending inventory, Dec. 31, 2009 20 Direct materials used Direct manufacturing labor costs Indirect manufacturing costs: Indirect manufacturing labor Plant supplies used Plant utilities Depreciation––plant and equipment Plant supervisory salaries Miscellaneous plant overhead Manufacturing costs incurred during 2009 Add beginning work-in-process inventory, Jan. 1, 2009 Total manufacturing costs to account for Deduct ending work-in-process, Dec. 31, 2009 Cost of goods manufactured $320 100 60 10 30 80 5 35 220 640 10 650 5 $645 2-33 (15–20 min.) Interpretation of statements (continuation of 2-32). 1. The schedule in 2-32 can become a Schedule of Cost of Goods Manufactured and Sold simply by including the beginning and ending finished goods inventory figures in the supporting schedule, rather than directly in the body of the income statement. Note that the term cost of goods manufactured refers to the cost of goods brought to completion (finished) during the accounting period, whether they were started before or during the current accounting period. Some of the manufacturing costs incurred are held back as costs of the ending work in process; similarly, the costs of the beginning work in process inventory become a part of the cost of goods manufactured for 2009. 2. The sales manager’s salary would be charged as a marketing cost as incurred by both manufacturing and merchandising companies. It is basically an operating cost that appears below the gross margin line on an income statement. In contrast, an assembler’s wages would be assigned to the products worked on. Thus, the wages cost would be charged to Work-in-Process and would not be expensed until the product is transferred through Finished Goods Inventory to Cost of Goods Sold as the product is sold. 3. The direct-indirect distinction can be resolved only with respect to a particular cost object. For example, in defense contracting, the cost object may be defined as a contract. Then, a plant supervisor working only on that contract will have his or her salary charged directly and wholly to that single contract. 4. Direct materials used = $320,000,000 ÷ 1,000,000 units = $320 per unit Depreciation on plant equipment = $80,000,000 ÷ 1,000,000 units = $80 per unit 5. Direct materials unit cost would be unchanged at $320 per unit. Depreciation cost per unit would be $80,000,000 ÷ 1,200,000 = $66.67 per unit. Total direct materials costs would rise by 20% to $384,000,000 ($320 per unit × 1,200,000 units), whereas total depreciation would be unaffected at $80,000,000. 6. Unit costs are averages, and they must be interpreted with caution. The $320 direct materials unit cost is valid for predicting total costs because direct materials is a variable cost; total direct materials costs indeed change as output levels change. However, fixed costs like depreciation must be interpreted quite differently from variable costs. A common error in cost analysis is to regard all unit costs as one—as if all the total costs to which they are related are variable costs. Changes in output levels (the denominator) will affect total variable costs, but not total fixed costs. Graphs of the two costs may clarify this point; it is safer to think in terms of total costs rather than in terms of unit costs. 2-38 (30 min.) Comprehensive problem on unit costs, product costs. 1. If 2 pounds of direct materials are used to make each unit of finished product, 100,000 units × 2 lbs., or 200,000 lbs. were used at $0.70 per pound of direct materials ($140,000 ÷ 200,000 lbs.). (The direct material costs of $140,000 are direct materials used, not purchased.) Therefore, the ending inventory of direct materials is 2,000 lbs. $0.70 = $1,400. 2. Direct materials costs Direct manufacturing labor costs Plant energy costs Indirect manufacturing labor costs Manufacturing Costs for 100,000 units Variable $140,000 $ 30,000 5,000 10,000 Fixed – – – 16,000 Total $140,000 30,000 5,000 26,000 Other indirect manufacturing costs Cost of goods manufactured 8,000 24,000 32,000 $193,000 $40,000 $233,000 Average unit manufacturing cost: $233,000 ÷ 100,000 units = $2.33 per unit $20,970 (given) = $2.33 per unit Finished goods inventory in units: = 9,000 units 3. Units sold in 2009 = Beginning inventory + Production – Ending inventory 0 + 100,000 – 9,000 = 91,000 = units Selling price in 2009 = $436,800 ÷ 91,000 = $4.80 per unit 4. Revenues (91,000 units sold × $4.80) Cost of units sold: Beginning finished goods, Jan. 1, 2009 Cost of goods manufactured $436,800 $ Cost of goods available for sale Ending finished goods, Dec. 31, 2009 Gross margin Operating costs: Marketing, distribution, and customer-service costs Administrative costs Operating income Note: 0 233,000 233,000 20,970 162,850 50,000 212,030 224,770 212,850 $ 11,920 Although not required, the full set of unit variable costs is: Direct materials cost $1.40 Direct manufacturing labor cost 0.30 Plant energy cost 0.05 Indirect manufacturing labor cost 0.10 Other indirect manufacturing cost 0.08 Marketing, distribution, and customer-service costs $1.35 = $1.93 per unit manufactured per unit sold
