LAB: ACIDS, BASES, AND THE pH SCALE Pre
advertisement
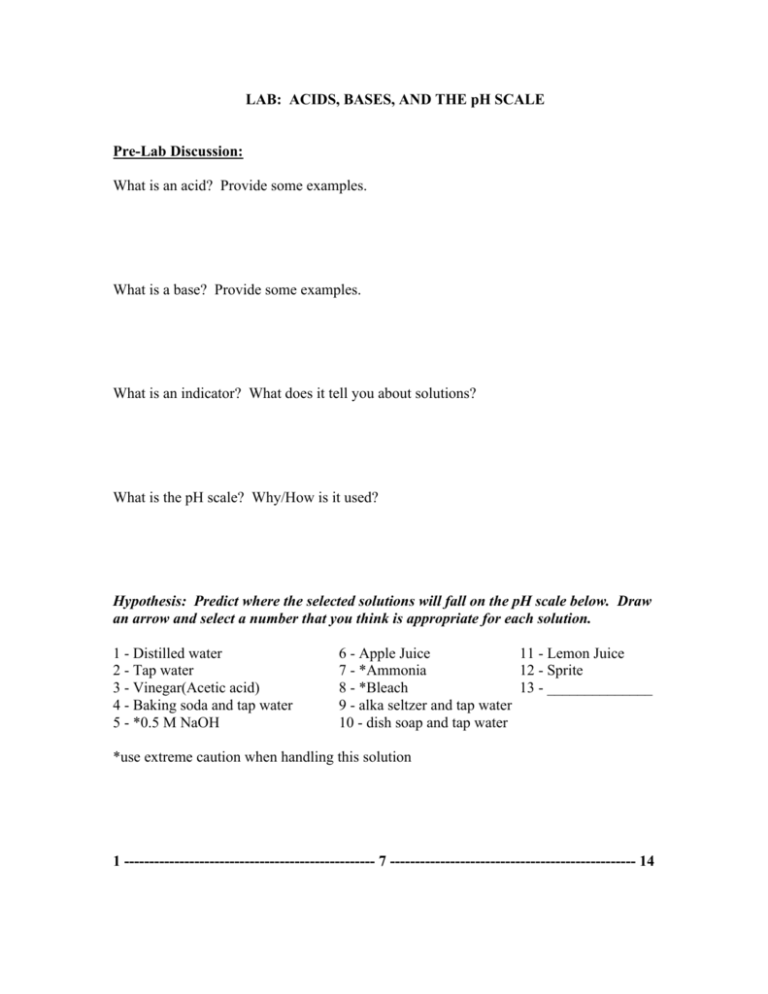
LAB: ACIDS, BASES, AND THE pH SCALE Pre-Lab Discussion: What is an acid? Provide some examples. What is a base? Provide some examples. What is an indicator? What does it tell you about solutions? What is the pH scale? Why/How is it used? Hypothesis: Predict where the selected solutions will fall on the pH scale below. Draw an arrow and select a number that you think is appropriate for each solution. 1 - Distilled water 2 - Tap water 3 - Vinegar(Acetic acid) 4 - Baking soda and tap water 5 - *0.5 M NaOH 6 - Apple Juice 11 - Lemon Juice 7 - *Ammonia 12 - Sprite 8 - *Bleach 13 - ______________ 9 - alka seltzer and tap water 10 - dish soap and tap water *use extreme caution when handling this solution 1 -------------------------------------------------- 7 ------------------------------------------------- 14 Materials: Micro well trays (2) Cabbage juice indicator pH paper and scale Various household chemicals Prepared acids and bases Pipettes Glass stirring rods Deionized water Procedure: 1. Add 5 drops of each of the selected solutions to each of the wells starting at “1” and moving clockwise around one of the trays. Be sure to keep track of which solution is placed in each well. 2. Add 5 drops of cabbage juice indicator to each of the wells and observe the color change. Decide on the proper order of solutions from most acidic to most basic. The spectrum produced by cabbage juice indicator goes from red (most acidic) >>>red>>> pink >>> purple(neutral) >>> blue >>> green >>> yellow >>> (most basic). . 3. Collect three long strips (10 cm each) of orange pH paper and place them on a paper towel. Try to hold this paper on the ends as the oils in your hands can influence your results. 4. Dip a glass stirring rod into each well, one at a time, and place it on the pH paper. Be sure to dip your stirring rod in the deionized water between each test to avoid error or contamination of your solutions. 5. Observe the color change and assign each solution a number based on the pH color chart on the front screen. 6. After compiling your data, complete the pH scale below with any corrections you need to make. Be sure to include specific numbers for each solution you tested. Final Results 1 -------------------------------------------------- 7 ------------------------------------------------- 14
