Financial Summary - City of Grosse Pointe Farms
advertisement
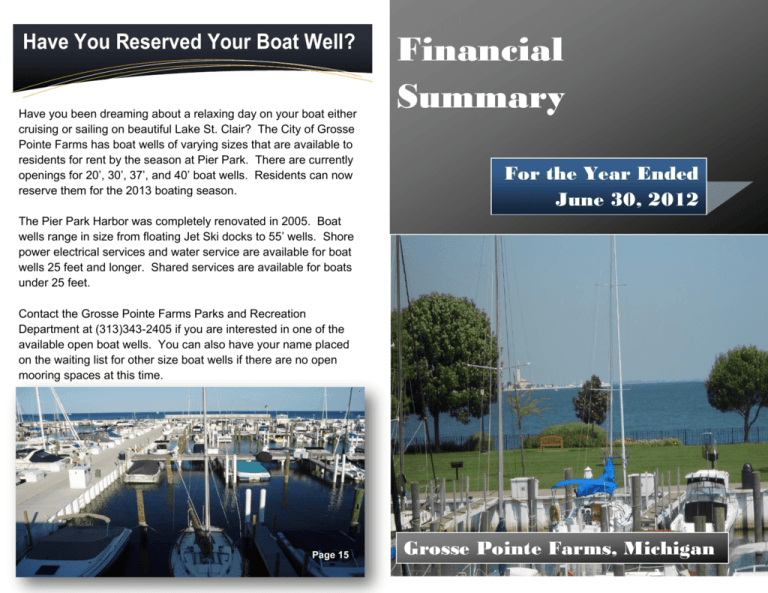
Have You Reserved Your Boat Well? Have you been dreaming about a relaxing day on your boat either cruising or sailing on beautiful Lake St. Clair? The City of Grosse Pointe Farms has boat wells of varying sizes that are available to residents for rent by the season at Pier Park. There are currently openings for 20’, 30’, 37’, and 40’ boat wells. Residents can now reserve them for the 2013 boating season. Financial Summary For the Year Ended June 30, 2012 The Pier Park Harbor was completely renovated in 2005. Boat wells range in size from floating Jet Ski docks to 55’ wells. Shore power electrical services and water service are available for boat wells 25 feet and longer. Shared services are available for boats under 25 feet. Contact the Grosse Pointe Farms Parks and Recreation Department at (313)343-2405 if you are interested in one of the available open boat wells. You can also have your name placed on the waiting list for other size boat wells if there are no open mooring spaces at this time. Page Page 1519 Grosse Pointe Farms, Michigan Expenditures Fast Facts General Fund Expenditures Residential Population: 9,479 (U.S. Census Bureau) Public Works 12% Recreation and Culture 10% Area: 2.6 square miles Other 21% Public Safety 37% Taxable Value: $710.0 million Council/Manager Form of Government The city is governed by an elected seven member council. The Council appoints a City Manager to oversee daily operations and administrative functions. Services Basic community services are the highest priority. These include police and fire protection; refuse collection, water and wastewater collection, street maintenance, public improvements, planning, zoning, and administrative services. Grosse Pointe Farm’s quality of life is also enhanced by recreation and leisure facilities including Pier Park and the War Memorial. General Government: $1.4 Million The General Government group of expenditures includes the following areas: City Council, City Manager, City Attorney, City Assessor, City Clerk, Elections, Accounting and Public Services. Other Financing Uses 7% Municipal Court 2% General Government 11% Public Safety: $4.6 Million Police and Fire Protection. Public Works: $1.5 Million Maintenance costs for major, local roads. Costs associated with refuse collection. Recreation & Culture: $1.2 Million The General Fund major program activities are summarized in seven areas: General Government, Public Safety, Municipal Court, Public Works, Recreation & Culture, Other, and Other Financing Uses. See the graph above for a breakdown of their percentages of total expenditures. Other expenditures include contingency and retirement fund contributions. Other Financing Uses include the transfer of funds to the Capital Projects Fund, Local Street Fund and Debt Service Fund. Costs to provide recreation activities and operation of the harbor. Page 1 Page 14 Fiscal Year Ending June 30, 2012 Financial Summary City Full-Time Equivalent Staffing 135 Other Funds Used to Manage City Dollars 130 125 120 115 2003 2004 2005 2006 2007 2008 2009 2010 2011 2012 In accordance with Generally Accepted Accounting Principles (GAAP), the City’s financial activities are accounted for in a variety of funds other than the General Fund. Special Revenue Funds such as the Major Street, Local Street and Community Refuse/Resource Recovery 8,000 Development Block Grant Funds are used to account for the proceeds of specific revenue sources (other than major capital projects) that are legally restricted to expenditures for specific purposes. 6,000 Debt Service Funds account for the accumulation of resources for the annual 4,000 payment of principal, interest and fees in connection with certain long-term debt other than debt payable from operations of a proprietary fund. 10,000 2,000 The Capital Projects Fund tracks financial resources for the acquisition or 0 2003 2004 2005 2006 2007 2008 2009 2010 2011 2012 construction of major capital facilities other than those financed by the operations of a proprietary fund. Enterprise Funds like Water, Sewer, Recycling and Municipal Radio System are Water Customers used to account for operations that are similar to private business. Tracking the net income of Enterprise Funds helps evaluate programs and direct financial administration. 4,105 4,100 4,095 Internal Service Funds such as Insurance Retention are used to account for the 4,090 financing of goods and services provided by one department to other departments of the government on a cost reimbursement basis. 4,085 4,080 4,075 2003 2004 2005 2006 2007 2008 2009 2010 2011 2012 Water Consumption MCF 100 For more detailed information where the totals are represented by function, you should review the Comprehensive Annual Financial Report (CAFR). Both this summary and the CAFR are available at the City Clerk, 90 Kerby Rd and the City’s website at: grossepointefarms.org. If necessary, call (313)640-1602 to request a copy. 80 60 40 20 0 2003 2004 2005 2006 2007 2008 2009 2010 2011 2012 Page 13 Fiscal Year Ending June 30, 2012 Financial Summary Page 2 City of Grosse Pointe Farms Economy Voter Turnout 90% 80% 2011 City Millage Rates 70% Grosse Pointe Grosse Pointe Grosse Pointe Grosse Pointe Northville Birmingham Plymouth Farmington Grosse Pointe Farms Park - City Woods Shores 14.0000 14.1080 14.2490 15.2397 15.3534 15.6005 16.0134 16.5856 17.1400 60% 50% 40% 30% 20% 10% 0% 2003 2004 2005 2006 2007 2008 2009 2010 2011 2012 This graph represents voter turnout by fiscal year July 1 – June 30 for November elections. The community’s taxable valuation (TV) has declined in recent years compared to the 1980’s and 1990’s. In 2011 our taxable value was $710,034,865 compared to $741,087,994 in 2010. City of Grosse Pointe Farms Employees Retirement System Schedule of Funding Progress (Pension Benefit) A State assessed value of $726 million represents approximately 50% of estimated current market value. Taxable value is determined by the prior year’s taxable value plus 5% or the consumer price index (whichever is less). Starting with the 1994 state equalized value as the base taxable value, the taxable value figure is multiplied by the tax rate to determine property tax revenue. 180.0% 160.0% 140.0% 120.0% 100.0% 80.0% 60.0% 40.0% 20.0% 0.0% PSRS GERS 2002 2003 2004 2005 2006 2007 2008 2009 2010 2011 2012 Page 3 Fiscal Year Ending June 30, 2012 Financial Summary The above chart expresses the actuarial value of assets as a percentage of the actuarial accrued liability, which provides one indication of the system’s funded status on an ongoing concern basis. Analysis of this percentage over time indicates whether the system is becoming financially stronger or weaker. Page 12 Operation Indicators by Function/Program City Clerk's Office Dog licenses issued Registered voters Fire Fire Department responses Emergency Medical Runs Parks & Recreation Vehicles Entering Park Municipal Court Court Case Load 2010 2011 2012 873 7,957 869 8,062 849 8,103 843 7,918 101 420 108 407 97 410 143 411 Value in Millions of Dollars 2009 Taxable vs. Assessed Value 1,200,000,000 Assessed Taxable 1,000,000,000 800,000,000 600,000,000 400,000,000 200,000,000 0 2003 2004 2005 2006 2007 2008 2009 2010 2011 2012 115,698 120,925 112,254 119,502 4,625 5,412 5,926 4,835 Millage Rate Mills Per $1,000 of TV 15.000 14.000 13.000 12.000 11.000 10.000 2003 2004 2005 2006 2007 2008 2009 2010 2011 2012 Page 11 Fiscal Year Ending June 30, 2012 Financial Summary Page 4 The General Fund is the general operating fund of the City and the main focus of this report. It is used to account for all financial resources except those required to be accounted for in another fund. General Fund activities are financed by revenues from general property taxes, state shared revenues and other sources. The General Fund uses the current financial resources measurement focus and the modified accrual basis of accounting. The graph below shows the total revenue and expenditures of this fund from 2003 to 2012. An indicator of financial strength and stability is a positive fund balance in the General Fund. Since 2003, the General Fund fund balance has grown from $3.6 to $4.9 million. Fund Balance is the difference between assets, liabilities, deferred outflows of resources and deferred inflows of resources. The financial community has recognized the City’s strong economic indicators and stable financial operations. Standard & Poor’s gave the City an “AA+” rating for limited tax general obligation bonds. General Fund Revenues and Expenditures Total Revenue Total Expenditure Performance Data Building Permits and Construction Building PermitsValue Value in $1,000,000 200 180 160 140 120 100 80 60 40 20 0 2003 In Millions $15 2004 2005 2006 2007 2008 2009 2010 2011 2012 Grosse Pointe Farms Building Department processes a wide range of construction permits each year. New construction and building improvements improved dramatically over the past few years with the start-up of several new homes. $10 $5 Police Physical Arrests $0 2003 2004 2005 2006 2007 2008 2009 2010 2011 2012 500 450 Property Tax Levy $11,000,000 400 350 300 $10,500,000 250 $10,000,000 200 $9,500,000 150 100 $9,000,000 50 0 $8,500,000 Figure Figure Figure 77 7 2003 2004 2005 2006 2007 2008 2009 2010 2011 2012 Page 5 Fiscal Year Ending June 30, 2012 Financial Summary 2003 2004 2005 2006 2007 2008 2009 2010 2011 2012 Page Page1014 www.grossepointefarms.org Internet access creates a 24-hour, 7day-a-week service window for citizens seeking information about the City of Grosse Pointe Farms. What’s online at www.grossepointefarms.org? City Newsletters Events Calendar City Council meeting agendas & minutes Building permit applications Business license and Park Pass application forms Annual budgets, financial summaries and other city publications Latest News City Ordinances Email access to city administrators Comprehensive Annual Financial Report (CAFR) Evaluating the City’s Financial Condition The information in this document has been drawn from the City of Grosse Pointe Farms Comprehensive Annual Financial Report (CAFR) for the fiscal year ended June 30, 2012. Complete financial statements of the City of Grosse Pointe Farms with additional demographic and economic information are published in the CAFR. General Fund – Fund Balance $6 $5 In Millions City of Grosse Pointe Farms website The City was awarded the Certificate of Achievement for Excellence in Financial Reporting by the Government Finance Officers Association of the United States and Canada (GFOA) for its CAFR for the fiscal year ended June 30, 2011. The Certificate of Achievement is the highest form of recognition for excellence in state and local government financial reporting. In order to be awarded a Certificate of Achievement, a government unit must publish an easily readable and efficiently organized comprehensive annual financial report, the contents of which conform to program standards. The CAFR must satisfy both generally accepted accounting principles and applicable legal requirements. A Certificate of Achievement is valid for a period of one year only. We believe our CAFR continues to conform to the Certificate of Achievement program requirements and we are submitting our CAFR for the current year to the GFOA. To request a copy of the CAFR, contact: John M. Lamerato, City Controller by mail at: 90 Kerby Rd., Grosse Pointe Farms, MI 48236 ; email at: jlamerato@grossepointefarms.org or call: (313)640-1602 Page 9 Fiscal Year Ending June 30, 2012 Financial Summary $4 $3 $2 $1 $0 2003 2004 2005 2006 2007 2008 2009 2010 2011 2012 Revenues and Expenditures (Millions) 2003 2004 2005 2006 2007 2008 2009 2010 2011 2012 $ 11.5 $ 11.7 $ 12.1 $ 12.7 $ 13.0 $ 13.2 $ 13.0 $ 12.9 $ 12.5 $ 12.7 Total Expenditures 12.1 11.5 11.9 12.6 12.6 13.3 12.9 12.2 13.9 12.5 Excess (Shortfall) (0.6) 0.2 0.2 0.1 0.4 (0.1) 0.1 0.7 (1.4) 0.2 Beginning Equity 4.2 3.7 Total Revenue 3.9 4.1 4.2 5.0 4.9 5.0 6.1 4.7 Ending Equity $ 3.6 As a % of Revenue 31.30% 33.33% 33.88% 33.07% 35.38% 37.12% 38.46% 44.19% 37.60% 38.58% $ 3.9 $ 4.1 $ 4.2 $ 4.6 $ 4.9 $ 5.0 $ 5.7 $ 4.7 $ 4.9 Page 6 Revenues Where the City Gets its Revenue The City of Grosse Pointe Farms collects funding from eight major sources. Beyond property taxes, other revenues include licenses and permits, federal grants, state shared revenue, charges for services, fines and forfeitures, investments income, and other financing sources. See the chart on page 8 for a breakdown of what percentage each element represents of the total revenue. Investment Income 1.0% Fines and Forfeitures 3.0% Other 2.0% Charges for Service 10.0% State Shared Revenue 6.0% Property Taxes: $9.5 Million The City’s total tax rate of $14.00 includes the General Fund, Refuse Collection and Debt Service. The City is below its tax rate capacity for general activities. The General Fund tax levy is $11.1916 mills of the 12.4176 mills. As indicated in the chart on page 8, the City’s tax rate represents just 31% of the total property tax bill for all taxing jurisdictions. Those tax dollars represent 75% of the City’s total revenue. Licenses and Permits 3.0% Property Tax 75.0% Licenses and Permits: $.4 Million Are mainly made up of building permits and trade licenses and permits. State-Shared Revenue: $.7 Million This money is revenue from the State of Michigan, mainly in the form of a return on sales tax revenue. Charges for Services: $1.3 Million Where Does Your Tax Dollar Go? Fees charged for services and sales. Some examples of charges for services include Parking Meters, Boat Mooring Fees and Rentals. City of GPF Investment Income: $.2 Million Generated from interest on investments. 31% Other Revenue: $.3 Million County & Local Schools & Library Community 45% College Generated primarily by rebate fees and lease income. Page 7 Fiscal Year Ending June 30, 2012 Financial Summary 24% Page 8
