AP Statistics Information
advertisement
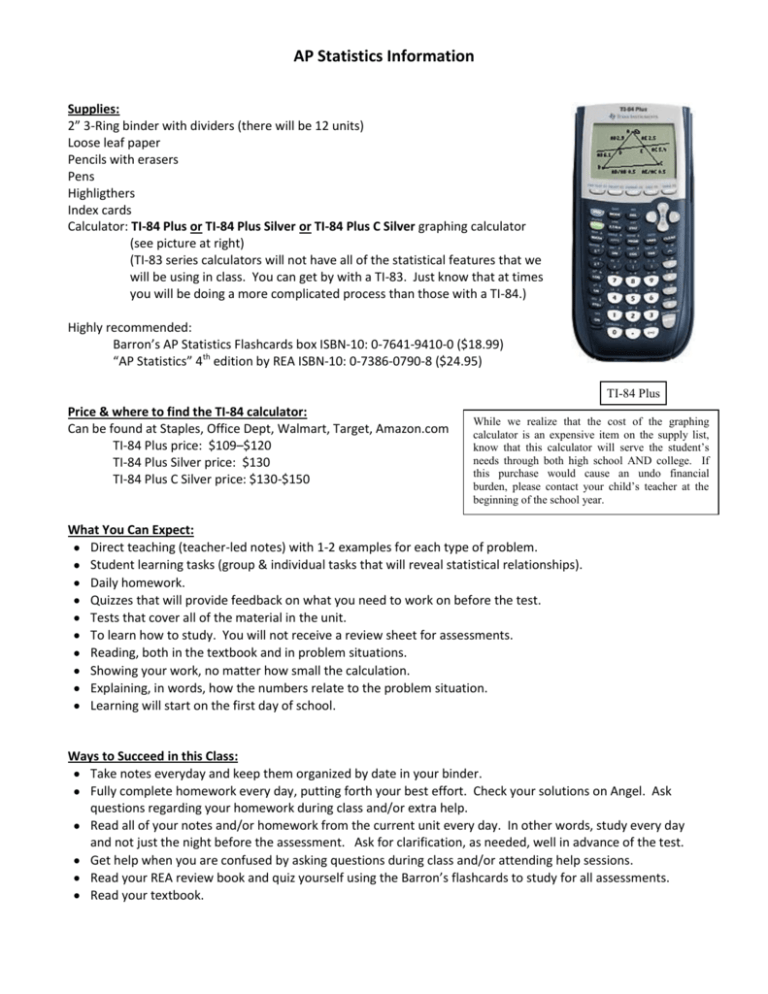
AP Statistics Information Supplies: 2” 3-Ring binder with dividers (there will be 12 units) Loose leaf paper Pencils with erasers Pens Highligthers Index cards Calculator: TI-84 Plus or TI-84 Plus Silver or TI-84 Plus C Silver graphing calculator (see picture at right) (TI-83 series calculators will not have all of the statistical features that we will be using in class. You can get by with a TI-83. Just know that at times you will be doing a more complicated process than those with a TI-84.) Highly recommended: Barron’s AP Statistics Flashcards box ISBN-10: 0-7641-9410-0 ($18.99) “AP Statistics” 4th edition by REA ISBN-10: 0-7386-0790-8 ($24.95) TI-84 Plus Price & where to find the TI-84 calculator: Can be found at Staples, Office Dept, Walmart, Target, Amazon.com TI-84 Plus price: $109–$120 TI-84 Plus Silver price: $130 TI-84 Plus C Silver price: $130-$150 While we realize that the cost of the graphing calculator is an expensive item on the supply list, know that this calculator will serve the student’s needs through both high school AND college. If this purchase would cause an undo financial burden, please contact your child’s teacher at the beginning of the school year. What You Can Expect: Direct teaching (teacher-led notes) with 1-2 examples for each type of problem. Student learning tasks (group & individual tasks that will reveal statistical relationships). Daily homework. Quizzes that will provide feedback on what you need to work on before the test. Tests that cover all of the material in the unit. To learn how to study. You will not receive a review sheet for assessments. Reading, both in the textbook and in problem situations. Showing your work, no matter how small the calculation. Explaining, in words, how the numbers relate to the problem situation. Learning will start on the first day of school. Ways to Succeed in this Class: Take notes everyday and keep them organized by date in your binder. Fully complete homework every day, putting forth your best effort. Check your solutions on Angel. Ask questions regarding your homework during class and/or extra help. Read all of your notes and/or homework from the current unit every day. In other words, study every day and not just the night before the assessment. Ask for clarification, as needed, well in advance of the test. Get help when you are confused by asking questions during class and/or attending help sessions. Read your REA review book and quiz yourself using the Barron’s flashcards to study for all assessments. Read your textbook. Topics You Can Study Over the Summer: These topics/problems are optional. However, completing them the week before the start of school will result in a smoother transition into this course. Show all of your work. 1. Use the following internet resource to define the terms below. Make an index card for each term. http://stattrek.com/Help/Glossary.aspx Statistics Population Sample Census Observational study Experiment Simple random sampling Stratified sampling Cluster sampling Systematic sampling Voluntary sample Convenience sample Undercoverage Nonresponse bias Response bias Factor (explanatory variable) Confounding (variable) Categorical variable Quantitative variable Discrete variable Continuous variable For #2-4, use the following formulas and information. You may use a scientific or graphing calculator to calculate your values. s a m p le m e a n xi x s a m p le s ta n d a rd d e v ia tio n n sx 1 n 1 xi x 2 Five-number summary consists of minimum, quartile 1(Q1), median, quartile 3(Q3), and maximum IQR = Q3 – Q1 2. Draw a dot plot of the data. Then calculate the sample mean, median, and standard deviation. 3, 3, 4, 7, 7, 1, 5, 9, 8, 7, 9, 4, 1, 2, 6, 1, 9, 6, 6, 4 3. The data below are the amount of time spent on the internet (in minutes) on a particular day for 30 students. Draw a histogram of the data. Use 7 groups. Then calculate the sample mean, median, and standard deviation. 7, 42, 72, 20, 43, 75, 24, 44, 77, 25, 45, 78, 25, 46, 79, 28, 47, 83, 28, 48, 87, 30, 48, 88, 32, 50, 135, 35, 51, 151 4. Calculate the sample mean, standard deviation, the five-number summary, and IQR. Then draw a box plot of the data. 19, 22, 23, 23, 23, 26, 26, 27, 28, 29, 29, 31, 32
