Reprinted from
h t t p : / / w w w. s n l. co m
Drilling down to banking stocks with the highest
implied upside
December 08, 2014
By Robin Majumdar
Shares of Houston-based Green Bancorp Inc. have the highest implied upside in the U.S. banking sector, according to an SNL analysis
of mean analyst price targets.
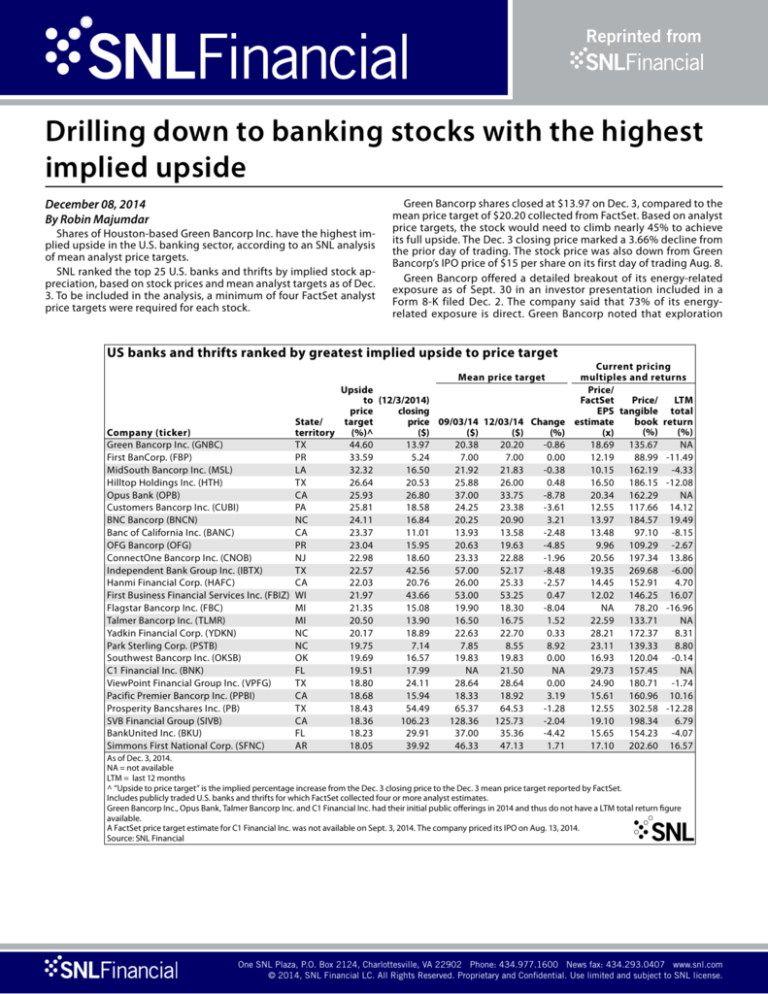
SNL ranked the top 25 U.S. banks and thrifts by implied stock appreciation, based on stock prices and mean analyst targets as of Dec.
3. To be included in the analysis, a minimum of four FactSet analyst
price targets were required for each stock.
Green Bancorp shares closed at $13.97 on Dec. 3, compared to the
mean price target of $20.20 collected from FactSet. Based on analyst
price targets, the stock would need to climb nearly 45% to achieve
its full upside. The Dec. 3 closing price marked a 3.66% decline from
the prior day of trading. The stock price was also down from Green
Bancorp’s IPO price of $15 per share on its first day of trading Aug. 8.
Green Bancorp offered a detailed breakout of its energy-related
exposure as of Sept. 30 in an investor presentation included in a
Form 8-K filed Dec. 2. The company said that 73% of its energyrelated exposure is direct. Green Bancorp noted that exploration
US banks and thrifts ranked by greatest implied upside to price target
Mean price target
Upside
to (12/3/2014)
closing
price
price 09/03/14 12/03/14 Change
target
State/
($)
($)
($)
(%)
(%)^
Company (ticker)
territory
Green Bancorp Inc. (GNBC)
TX
44.60
13.97
20.38
20.20
-0.86
First BanCorp. (FBP)
PR
33.59
5.24
7.00
7.00
0.00
MidSouth Bancorp Inc. (MSL)
LA
32.32
16.50
21.92
21.83
-0.38
Hilltop Holdings Inc. (HTH)
TX
26.64
20.53
25.88
26.00
0.48
Opus Bank (OPB)
CA
25.93
26.80
37.00
33.75
-8.78
Customers Bancorp Inc. (CUBI)
PA
25.81
18.58
24.25
23.38
-3.61
BNC Bancorp (BNCN)
NC
24.11
16.84
20.25
20.90
3.21
Banc of California Inc. (BANC)
CA
23.37
11.01
13.93
13.58
-2.48
OFG Bancorp (OFG)
PR
23.04
15.95
20.63
19.63
-4.85
ConnectOne Bancorp Inc. (CNOB)
NJ
22.98
18.60
23.33
22.88
-1.96
Independent Bank Group Inc. (IBTX)
TX
22.57
42.56
57.00
52.17
-8.48
Hanmi Financial Corp. (HAFC)
CA
22.03
20.76
26.00
25.33
-2.57
First Business Financial Services Inc. (FBIZ) WI
21.97
43.66
53.00
53.25
0.47
Flagstar Bancorp Inc. (FBC)
MI
21.35
15.08
19.90
18.30
-8.04
Talmer Bancorp Inc. (TLMR)
MI
20.50
13.90
16.50
16.75
1.52
Yadkin Financial Corp. (YDKN)
NC
20.17
18.89
22.63
22.70
0.33
Park Sterling Corp. (PSTB)
NC
19.75
7.14
7.85
8.55
8.92
Southwest Bancorp Inc. (OKSB)
OK
19.69
16.57
19.83
19.83
0.00
C1 Financial Inc. (BNK)
FL
19.51
17.99
NA
21.50
NA
ViewPoint Financial Group Inc. (VPFG)
TX
18.80
24.11
28.64
28.64
0.00
Pacific Premier Bancorp Inc. (PPBI)
CA
18.68
15.94
18.33
18.92
3.19
Prosperity Bancshares Inc. (PB)
TX
18.43
54.49
65.37
64.53
-1.28
SVB Financial Group (SIVB)
CA
18.36
106.23
128.36
125.73
-2.04
BankUnited Inc. (BKU)
FL
18.23
29.91
37.00
35.36
-4.42
Simmons First National Corp. (SFNC)
AR
18.05
39.92
46.33
47.13
1.71
Current pricing
multiples and returns
Price/
LTM
Price/
FactSet
EPS tangible total
book return
estimate
(%)
(%)
(x)
18.69
135.67
NA
12.19
88.99 -11.49
10.15
162.19 -4.33
16.50
186.15 -12.08
20.34
162.29
NA
12.55
117.66 14.12
13.97
184.57 19.49
13.48
97.10 -8.15
9.96
109.29 -2.67
20.56
197.34 13.86
19.35
269.68 -6.00
14.45
152.91
4.70
12.02
146.25 16.07
NA
78.20 -16.96
22.59
133.71
NA
28.21
172.37
8.31
23.11
139.33
8.80
16.93
120.04 -0.14
29.73
157.45
NA
24.90
180.71 -1.74
15.61
160.96 10.16
12.55
302.58 -12.28
19.10
198.34
6.79
15.65
154.23 -4.07
17.10
202.60 16.57
As of Dec. 3, 2014.
NA = not available
LTM = last 12 months
^ “Upside to price target” is the implied percentage increase from the Dec. 3 closing price to the Dec. 3 mean price target reported by FactSet.
Includes publicly traded U.S. banks and thrifts for which FactSet collected four or more analyst estimates.
Green Bancorp Inc., Opus Bank, Talmer Bancorp Inc. and C1 Financial Inc. had their initial public offerings in 2014 and thus do not have a LTM total return figure
available.
A FactSet price target estimate for C1 Financial Inc. was not available on Sept. 3, 2014. The company priced its IPO on Aug. 13, 2014.
Source: SNL Financial
h t t p : / / w w w. s n l . c o m
One SNL Plaza, P.O. Box 2124, Charlottesville, VA 22902 Phone: 434.977.1600 News fax: 434.293.0407 www.snl.com
© 2014, SNL Financial LC. All Rights Reserved. Proprietary and Confidential. Use limited and subject to SNL license.
h t t p : / / w w w. s n l. co m
and production represents about 11% of its total loan portfolio, while
energy-related service companies make up about 8% of the total loan
portfolio.
This was higher than some had previously thought. Keefe Bruyette
& Woods analyst Brady Gailey, for example, wrote in a Dec. 3 report
that he had previously believed the bank’s exposure to energy to be
about 10% of loans, as opposed to 19%, based on commentary from
the bank’s third-quarter earnings call. Nonetheless, Gailey maintained his “outperform” rating, EPS estimates and $20 price target on
the stock after speaking to management. “With the outsized drop in
oil prices recently and [Green Bancorp’s] now greater than previously
thought exposure to energy/oil, our call has more embedded risk. We
believe the near-term risk is mostly on slowing loan growth, which
could reduce future earnings and possible reduce [Green Bancorp’s]
earnings multiple on the lower growth rate,” the analyst wrote, adding that recent weakness in the bank’s shares is likely “overdone.”
“For now, we’re leaving EPS unchanged and will continue to monitor these impacts on [Green Bancorp] and all the other Texas names,”
Gailey wrote.
Many of the banks in SNL’s analysis had strong ties to the energy
and oil industries. Many have seen share prices fall more than usual in
recent weeks, helping lead to some large implied upside values. The
spot price of one barrel of West Texas Intermediate oil fell to below
$69 on Dec. 1 from more than $95 at the beginning of 2014, according to information from the U.S. Energy Information Administration.
Based on analyst forecasts, five other banking stocks also had potential upsides of greater than 25%: San Juan-based First BanCorp.;
Lafayette, La.-based MidSouth Bancorp Inc.; Dallas-based Hilltop
Holdings Inc.; Irvine, Calif.-based Opus Bank; and Wyomissing, Pa.based Customers Bancorp Inc.
First BanCorp., which had the highest implied upside the last time
SNL conducted this analysis in early August, said that it stands to
directly gain from the trend of falling oil prices. President and CEO
Aurelio Alemán-Bermudez stated during the bank’s third-quarter
earnings call that “the trend of the cost of oil is positive for Puerto
Rico and it’s positive for [the Puerto Rico Electric Power Authority].”
First BanCorp. said in its most recent 10-Q filing that Puerto Rico’s
economy “is highly sensitive to global oil prices since the island does
not have a significant mass transit system available to the public and
most of its electricity is powered by oil, making it highly vulnerable to
fluctuations in oil prices.” The filing subsequently stated that a bill “recently approved by the Senate proposes the creation of a regulatory
agency that will approve or reject energy rates for all energy producers in Puerto Rico and would be responsible for opening Puerto Rico’s
energy market to competition.” The bank said this is one of two proposals intended to substantially reduce Puerto Rico’s energy costs.
MidSouth Bancorp’s top executive suggested in a recent interview
with SNL that fears about the drop in oil prices are overblown. “There
is no panic in Louisiana and Texas today,” MidSouth President, CEO
and COO Clive “Rusty” Cloutier said.
“We’ve seen this play out a hundred times. We didn’t get more aggressive because it was $140 a barrel and we ain’t going to turn it off
because it hit $70. That’s how they look at it,” Cloutier said of his oil
and gas customers.
Bank and thrift stocks have generally underperformed broader
markets for much of the past 12 months. Since early November, the
S&P 500, the SNL U.S. Bank Index and the SNL U.S. Thrift Index have
trended in the same direction, with the S&P 500 continuing to outperform the two banking indexes. i
Total return for bank and thrift indexes, S&P 500 for the last 12 months (%)
SNL U.S. Thrift
SNL U.S. Bank
S&P 500
20
15
10
5
0
-5
As of Dec. 3, 2014.
Source: SNL Financial
h t t p : / / w w w. s n l . c o m
One SNL Plaza, P.O. Box 2124, Charlottesville, VA 22902 Phone: 434.977.1600 News fax: 434.293.0407 www.snl.com
© 2014, SNL Financial LC. All Rights Reserved. Proprietary and Confidential. Use limited and subject to SNL license.

