Possible Rubric for Statistics Exams and Papers
advertisement
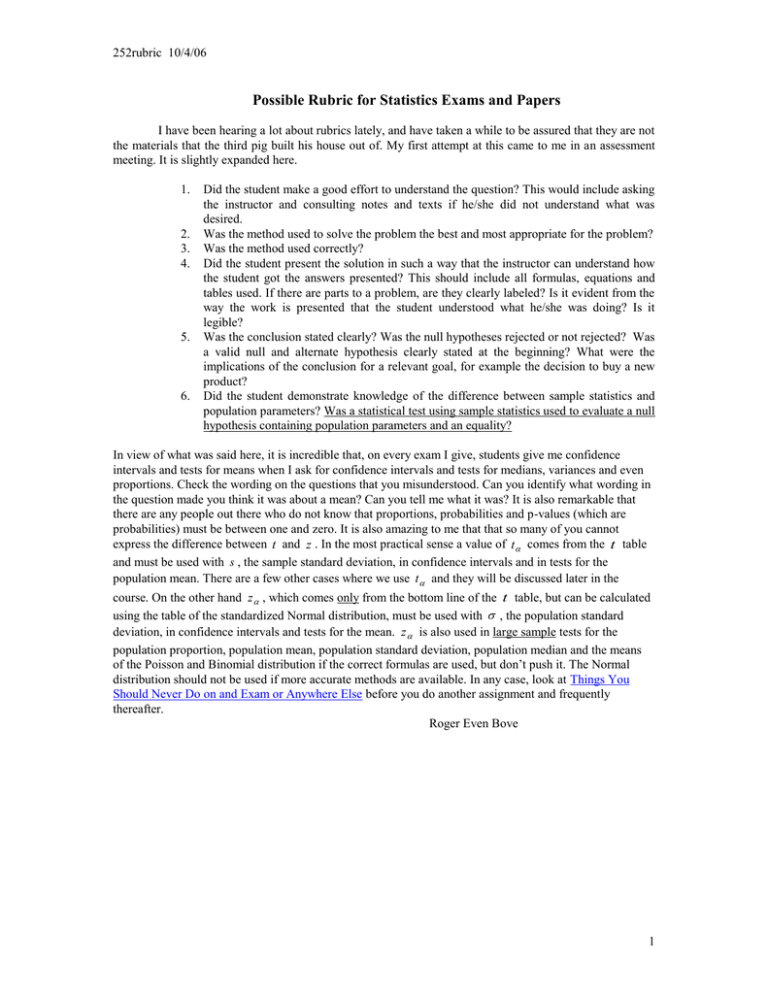
252rubric 10/4/06 Possible Rubric for Statistics Exams and Papers I have been hearing a lot about rubrics lately, and have taken a while to be assured that they are not the materials that the third pig built his house out of. My first attempt at this came to me in an assessment meeting. It is slightly expanded here. 1. 2. 3. 4. 5. 6. Did the student make a good effort to understand the question? This would include asking the instructor and consulting notes and texts if he/she did not understand what was desired. Was the method used to solve the problem the best and most appropriate for the problem? Was the method used correctly? Did the student present the solution in such a way that the instructor can understand how the student got the answers presented? This should include all formulas, equations and tables used. If there are parts to a problem, are they clearly labeled? Is it evident from the way the work is presented that the student understood what he/she was doing? Is it legible? Was the conclusion stated clearly? Was the null hypotheses rejected or not rejected? Was a valid null and alternate hypothesis clearly stated at the beginning? What were the implications of the conclusion for a relevant goal, for example the decision to buy a new product? Did the student demonstrate knowledge of the difference between sample statistics and population parameters? Was a statistical test using sample statistics used to evaluate a null hypothesis containing population parameters and an equality? In view of what was said here, it is incredible that, on every exam I give, students give me confidence intervals and tests for means when I ask for confidence intervals and tests for medians, variances and even proportions. Check the wording on the questions that you misunderstood. Can you identify what wording in the question made you think it was about a mean? Can you tell me what it was? It is also remarkable that there are any people out there who do not know that proportions, probabilities and p-values (which are probabilities) must be between one and zero. It is also amazing to me that that so many of you cannot express the difference between t and z . In the most practical sense a value of t comes from the t table and must be used with s , the sample standard deviation, in confidence intervals and in tests for the population mean. There are a few other cases where we use t and they will be discussed later in the course. On the other hand z , which comes only from the bottom line of the t table, but can be calculated using the table of the standardized Normal distribution, must be used with , the population standard deviation, in confidence intervals and tests for the mean. z is also used in large sample tests for the population proportion, population mean, population standard deviation, population median and the means of the Poisson and Binomial distribution if the correct formulas are used, but don’t push it. The Normal distribution should not be used if more accurate methods are available. In any case, look at Things You Should Never Do on and Exam or Anywhere Else before you do another assignment and frequently thereafter. Roger Even Bove 1
