L05 Leverage
advertisement
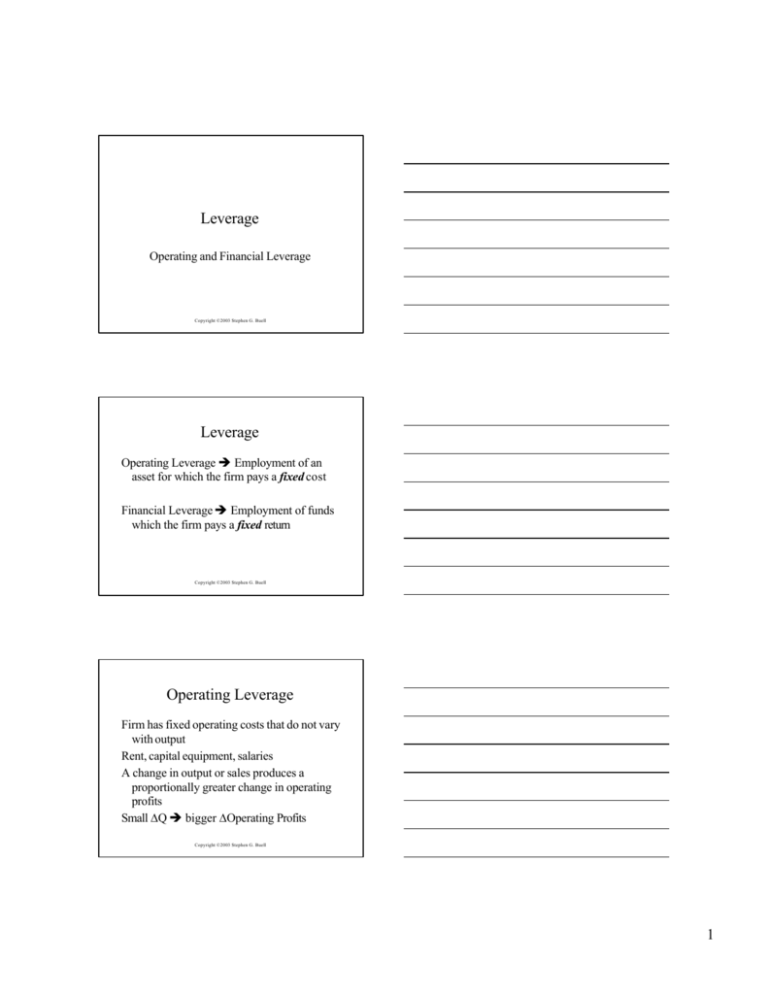
Leverage Operating and Financial Leverage Copyright ©2003 Stephen G. Buell Leverage Operating Leverage è Employment of an asset for which the firm pays a fixed cost Financial Leverage è Employment of funds which the firm pays a fixed return Copyright ©2003 Stephen G. Buell Operating Leverage Firm has fixed operating costs that do not vary with output Rent, capital equipment, salaries A change in output or sales produces a proportionally greater change in operating profits Small ∆Q è bigger ∆Operating Profits Copyright ©2003 Stephen G. Buell 1 Degree of Operating Leverage An elasticitycoefficient measuringt h eresponsive nesso f operatingprofits to a changein outputor sales % ∆OperatingProfit OL = ≥1 % ∆Outputor sales d π dQ OL = ÷ π Q π = profit, Q = o u t p u t P = price per unit,TR = total revenue,TC = totalcost AVC = avg variablecost, VC = total variablecost FC = fixed cost π = TR - TC TR = P ⋅ Q TC = VC + FC VC = AVC⋅ Q π = P ⋅ Q - AVC⋅ Q - FC if P, AVCand FC are constant,dπ = dQ(P - AVC) ∴ OL = Q(P - AVC) ≥1 Q(P - AVC)- FC Copyright ©2003 Stephen G. Buell Operating leverage example P = $66/unit AVC= $27/unit FC = $195,000 OL = Q(P - AVC) Q(66 - 27) = Q(P - AVC) - FC Q(66 - 27) - 195,000 if Q = 6,000 units, OL = 6 if Q = 8,000 units, OL = 2.67 if Q = 20,000 units, OL = 1.33 Copyright ©2003 Stephen G. Buell Leverage observations Operating leverage decreases as output increases Fixed costs are decreasing in relative importance and variable costs are increasing in relative importance as output rises Thus, the degree of operating leverage is declining Copyright ©2003 Stephen G. Buell 2 Fixed vs. variable operating costs Fixed: Own your own fleet of trucks for which you make a fixed monthly payment to local Ford dealer (high OL) Variable: Rent trucks on an as -needed basis from local U-Haul Center What if: sales really take off? What if: sales really plummet? Magnified gains and losses with owning Copyright ©2003 Stephen G. Buell Financial Leverage How much of a firm’s assets are financed by borrowed money (debt) vs. how much by stockholders’ money (equity) Two common ratios measure leverage: Debt to Asset Ratio Times Interest Earned Coverage Ratio Copyright ©2003 Stephen G. Buell Debt to Asset Ratio total debt total assets total equity equity ratio = total assets High debt ratio (firm = 70%, ind avg = 55%) debt ratio = chance for magnified gains and losses greater chance of bankruptcy and failure Low debt ratio (firm = 30%, ind avg = 55%) sacrificing of profits tax - deductibil ity of interest payments Copyright ©2003 Stephen G. Buell 3 Times Interest Earned Ratio OperatingIncome (EBIT) Interest Charges ability topay TIE = amount coming due Primary determinant of a firm' s bond ratings high quality AAA, AA TIE > 6 medium quality A, BBB, BB 3 < TIE < 6 speculative quality B, CCC, CC, C TIE < 3 TIE = Copyright ©2003 Stephen G. Buell Initial Position Balance Sheet Income Statement Total Assets 1000 Assume ROA=10% Operating income=.10x1000=100 Debt 0 Equity 1000 -----------------------Total Claims 1000 -interest charges -0 -------------------------Net income = 100 ROE = 100/1000=10% Copyright ©2003 Stephen G. Buell Favorable leverage Balance Sheet Total Assets Income Statement 1500 Debt (6%) 500 Equity 1000 ---------------------------Total Claims 1500 Assume ROA=10% Operating income=.10x1500=150 -interest char=.06x500=-30 -------------------------Net income = 120 ROE = 120/1000=12% Copyright ©2003 Stephen G. Buell 4 Unfavorable leverage Income Statement Balance Sheet Total Assets 1500 Debt (6%) 500 Equity 1000 ----------------------------Total Claims 1500 Assume ROA=10% on old but only 3% on new Operating income = .10x1000+.03x500=115 -interest char=.06x500=-30 -------------------------Net income = 85 ROE = 85/1000=8.5% Copyright ©2003 Stephen G. Buell Degree of Financial Leverage Elasticity coefficien t that measures the responsive ness of net income to changes in operating income FL = % ∆Net Income ≥1 % ∆Operating Income FL = EBIT EBIT - int charges Copyright ©2003 Stephen G. Buell Degree of Total Leverage Elasticity coefficien t that measures the responsive ness of net income to changes in output or sales Borrowing money by issuing debt and using the funds to automate the plant or to buy a fleet of trucks and then having to make fixed monthly payments to Ford dealer TL = OL x FL TL = % ∆Net Income ≥1 % ∆ Output or sales Copyright ©2003 Stephen G. Buell 5


