Vanguard
Vanguard International Growth Fund
Investor Class
As of 9/30/2015
Equities | Foreign
Portfolio Net Assets
$23.09 Billion
(As of 6/30/2015)
Inception Date
9/30/1981
CUSIP
921910204
Portfolio Strategies
Symbol
VWIGX
Expense Ratio 1
Gross 0.47% | Net 0.47%
Benchmark Index
MSCI All Country World
Excluding-U.S. Index (GR)
Performance
The investment seeks to provide long-term capital
appreciation. The fund invests predominantly in the
stocks of companies located outside the United
States and is expected to diversify its assets in
countries across developed and emerging markets.
In selecting stocks, the fund's advisors evaluate
foreign markets around the world and choose large-,
mid-, and small-capitalization companies considered
to have above-average growth potential. The fund
uses multiple investment advisors.
Total Return
Average Annual Total Return
C
Morningstar Category
3 Months
YTD
1 Year
3 Years
5 Years
10 Years
Since
Inception
Vanguard International Growth
Fund
-12.97%
-7.20%
-9.95%
4.77%
3.64%
4.40%
10.11%
MSCI All Country World ExcludingU.S. Index (GR)
-12.10%
-8.28%
-11.78%
2.78%
2.27%
3.49%
–
Morningstar Foreign Large Growth
Average
-9.36%
-3.40%
-4.95%
5.40%
4.39%
3.90%
–
Foreign Large Growth
The returns quoted represent past performance, which is no guarantee of future results. Returns and the
principal value of your investment will fluctuate. Current performance may be higher or lower than that
shown, and you may have a gain or a loss when you redeem your mutual fund shares. For current
performance information, including performance to the most recent month-end, call 800 842-2888.
Performance may reflect waivers or reimbursements of certain expenses. Absent these waivers or
reimbursement arrangements, performance may be lower.
Morningstar RatingTM
Overall
3 Years
301
301
5 Years
277
10 Years
183
The Overall Morningstar Rating is based on
risk-adjusted return, and is a weighted
average of the applicable 3-, 5- and 10-year
ratings.
Morningstar Style BoxTM
Value
1
Accumulations in mutual funds not managed by TIAA-CREF may be subject to administrative charges.
These charges are subject to change. Please review current documents related to your plan.
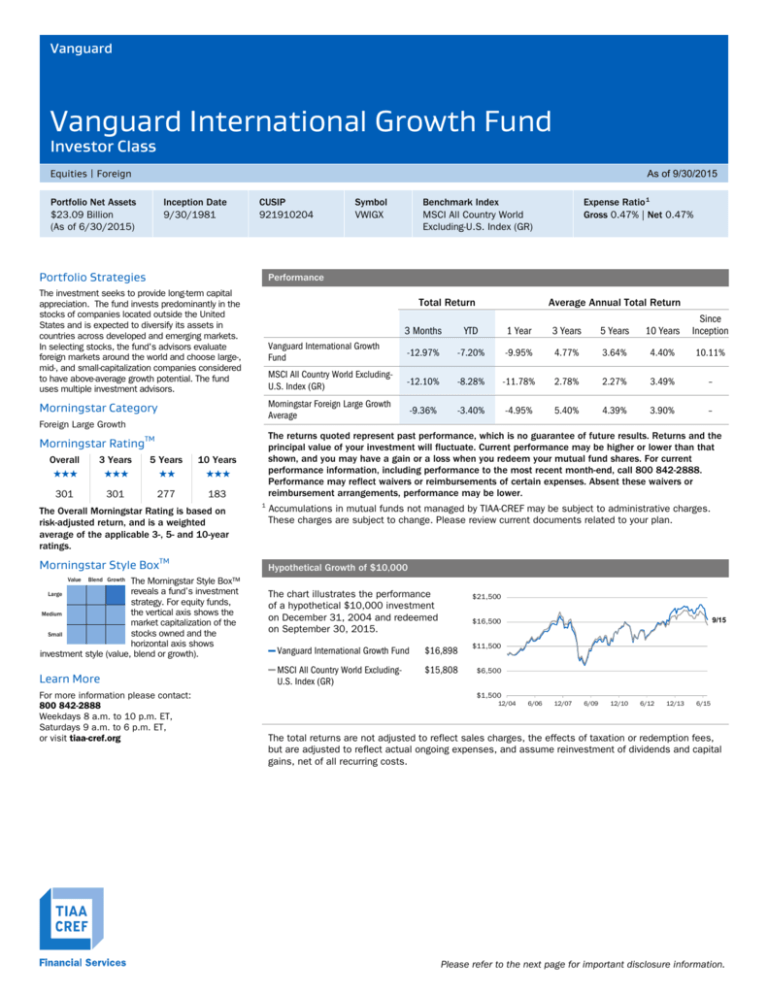
Hypothetical Growth of $10,000
Blend Growth
The Morningstar Style Box™
reveals a fund’s investment
Large
strategy. For equity funds,
the vertical axis shows the
Medium
market capitalization of the
stocks owned and the
Small
horizontal axis shows
investment style (value, blend or growth).
Learn More
For more information please contact:
800 842-2888
Weekdays 8 a.m. to 10 p.m. ET,
Saturdays 9 a.m. to 6 p.m. ET,
or visit tiaa-cref.org
The chart illustrates the performance
of a hypothetical $10,000 investment
on December 31, 2004 and redeemed
on September 30, 2015.
$21,500
9/15
$16,500
— Vanguard International Growth Fund
$16,898
$11,500
— MSCI All Country World ExcludingU.S. Index (GR)
$15,808
$6,500
$1,500
12/04
6/06
12/07
6/09
12/10
6/12
12/13
6/15
The total returns are not adjusted to reflect sales charges, the effects of taxation or redemption fees,
but are adjusted to reflect actual ongoing expenses, and assume reinvestment of dividends and capital
gains, net of all recurring costs.
Please refer to the next page for important disclosure information.
Vanguard
Vanguard International Growth Fund
Investor Class
As of 9/30/2015
Equities | Foreign
The portfolio data shown below is based on information available at the time of publication. More recent information may be available online.
Portfolio Composition
Sector
(As of 6/30/15)
% of Portfolio Investments
Top 10 Holdings 2
Holding
(As of 6/30/15)
Portfolio Statistics
% of Net Assets
Portfolio Benchmark
23.51%
Aia
3.37%
Alpha (3 Yr)*
Consumer Cyclical
20.72%
Tencent Holdings Ltd
3.33%
Beta (3 Yr)*
Technology
15.42%
Baidu Inc ADR
2.78%
Average Market Cap
Industrials
12.16%
Inditex
2.49%
Healthcare
8.31%
Fiat Chrysler Automobiles NV
2.34%
Consumer Defensive
7.48%
Alibaba Group Holding Ltd ADR
Basic Materials
5.84%
Amazon.com Inc
Communication Services
4.16%
SoftBank Group Corp
1.95%
Energy
2.20%
Rolls-Royce Holdings plc
1.80%
Real Estate
0.21%
SMC Corp
1.78%
Financial Services
Current Asset Allocation
(As of 6/30/15)
% of Portfolio Investments
International Equity
93.40%
U.S. Equity
2.72%
Other
2.22%
Short Term Investments
1.64%
U.S. Fixed Income
0.01%
1.87
–
1.05
–
$32.00
$26.75
Price/Book
2.21
1.57
R Squared (3 Yr)*
0.94
–
2.28%
Sharpe Ratio (3 Yr)*
0.43
0.29
2.01%
Standard Deviation
(3 Yr Annualized)*
12.58
11.61
Turnover
As of 8/31/14
21.0%
–
182
–
# Holdings
Please refer to Portfolio Statistics Definitions
section.
*Risk statistics are calculated based on the
share class shown.
Top 5 Countries
Country
(As of 6/30/15)
% of Portfolio Investments
United Kingdom
16.06%
Japan
13.05%
China
11.57%
Germany
7.33%
Switzerland
5.99%
About the Benchmark
The MSCI All Country World Excluding-U.S. Index (GR) is a free float-adjusted market capitalization weighted index that is designed to measure the equity
market performance of developed and emerging market nations, excluding the United States. The returns noted above include the calculation of reinvested
dividends. You cannot invest directly in any index. Index returns do not reflect a deduction for fees or expenses.
Important Information
2
The top 10 holdings are subject to change and may not be representative of the fund's current or future investments. The holdings listed only include the
fund's long-term investments and may exclude any temporary cash investments and equity index products. The holdings listed should not be considered a
recommendation to buy or sell a particular security.
Mutual funds are offered through your plan sponsor's retirement plan, which is recordkept by TIAA-CREF. Funds are offered at that day's net asset value
(NAV), and the performance is displayed accordingly. Performance at NAV does not reflect sales charges, which are waived through your retirement plan. If
included, the sales charges would have reduced the performance quoted.
Investment, insurance and annuity products: are not FDIC insured, are not bank guaranteed, are not deposits, are not insured by any federal
government agency, are not a condition to any banking service or activity, and may lose value.
TIAA-CREF Individual & Institutional Services, LLC, Teachers Personal Investors Services, Inc., and Nuveen Securities, LLC, Members FINRA and SIPC,
distribute securities products. You should consider the investment objectives, risks, charges and expenses carefully before investing. Please call 877
518-9161 for a prospectus that contains this and other information. Please read the prospectus carefully before investing.
Continued on next page…
Vanguard
Vanguard International Growth Fund
Equities | Foreign
Investor Class
As of 9/30/2015
Morningstar Disclosure
Data Provided by Morningstar, Inc. ©2015 Morningstar, Inc. All Rights Reserved. The information contained herein: (1) is proprietary to Morningstar and/or
its content providers; (2) may not be copied or distributed; and (3) is not warranted to be accurate, complete or timely. Neither Morningstar nor its content
providers are responsible for any damages or losses arising from any use of this information. Neither TIAA nor its affiliates has independently verified the
accuracy or completeness of this information.
The Morningstar Category classifies a fund based on its investment style as measured by underlying portfolio holdings (portfolio statistics and
compositions over the past three years). If the fund is new and has no portfolio, Morningstar estimates where it will fall before assigning a more permanent
category. When necessary, Morningstar may change a category assignment based on current information.
To determine a fund's star rating for a given time period (three, five, or 10 years), the fund's risk-adjusted return (including the effects of sales charges,
loads and redemption fees) is plotted on a bell curve. The top 10% of funds in each category receive 5 stars, the next 22.5% receive 4 stars, the next 35%
earn 3 stars, the next 22.5% receive 2 stars, and the bottom 10% receive 1 star. Where applicable, ratings are based on linked performance that
considers the differences in expense ratios. Morningstar RatingTM is for individual share classes only. Other classes may have different performance
characteristics.
A Note About Risks
This fund is subject to a number of risks, which include the following:
Country or Region: Investments in securities from a particular country or region may be subject to the risk of adverse social, political, regulatory, or economic
events occurring in that country or region. Country- or region-specific risks also include the risk that adverse securities markets or exchange rates may impact
the value of securities from those areas. Currency: Investments in securities traded in foreign currencies or more directly in foreign currencies are subject to
the risk that the foreign currency will decline in value relative to the U.S. dollar, which may reduce the value of the portfolio. Investments in currency hedging
positions are subject to the risk that the value of the U.S. dollar will decline relative to the currency being hedged, which may result in a loss of money on the
investment as well as the position designed to act as a hedge. Cross-currency hedging strategies and active currency positions may increase currency risk
because actual currency exposure may be substantially different from that suggested by the portfolio’s holdings. Equity Securities: The value of equity
securities, which include common, preferred, and convertible preferred stocks, will fluctuate based on changes in their issuers’ financial conditions, as well
as overall market and economic conditions, and can decline in the event of deteriorating issuer, market, or economic conditions. Loss of Money: Because the
investment’s market value may fluctuate up and down, an investor may lose money, including part of the principal, when he or she buys or sells the
investment. Management: Performance is subject to the risk that the advisor’s asset allocation and investment strategies do not perform as expected, which
may cause the portfolio to underperform its benchmark, other investments with similar objectives, or the market in general. The investment is subject to the
risk of loss of income and capital invested, and the advisor does not guarantee its value, performance, or any particular rate of return. Market/Market
Volatility: The market value of the portfolio’s securities may fall rapidly or unpredictably because of changing economic, political, or market conditions, which
may reduce the value of the portfolio. Not FDIC Insured: The investment is not a deposit or obligation of, or guaranteed or endorsed by, any bank and is not
insured by the Federal Deposit Insurance Corporation, the Federal Reserve Board, or any other U.S. governmental agency.
Portfolio Statistics Definitions
Alpha (3 Yr) is a risk statistic used to measure performance on a risk-adjusted basis. Alpha takes the volatility (price risk) of an investment and compares
its risk-adjusted performance to a benchmark. The risk-adjusted excess return of the investment relative to the return of the benchmark is an investment's
alpha.
Average Market Cap is the average market capitalization of stocks in a portfolio, each weighted by its proportion of assets.
Beta (3 Yr) is a risk statistic used to measure the magnitude of past share-price fluctuations in relation to the ups and downs of the overall market (or
appropriate market index). If a security has a beta greater than 1, that security’s price can be expected to be more volatile than the market.
Price/Book is the ratio of a stock's total market capitalization to the company's net assets.
R Squared (3 Yr) is a risk statistic that measures how much of an investment’s performance can be explained by the returns from the overall market (or
benchmark index). If an investment’s total return precisely matched that of the overall market or benchmark, its R squared would be 1.00. If an
investment’s return bore no relationship to the market’s returns, its R squared would be 0.
Sharpe Ratio (3 Yr) is a risk statistic used to measure the excess return per unit of risk in an investment asset. The higher the Sharpe ratio, the better the
return. Excess return is the rate of return above and beyond the risk-free rate, which is usually the T-bill rate, or in excess of a market measure, such as an
index fund.
Standard Deviation (3 Yr Annualized) is a risk statistic that measures an investment's past volatility, based on a sample. The higher the standard
deviation, the higher the volatility. It is not a measure of performance and should not be considered relative to an investment's annual returns. Please note
that past standard deviation is not a predictor of future volatility or risk.
Turnover is calculated by dividing the lesser of purchases or sales by the average value of portfolio assets during a period. Turnover is based on the
portfolio's fiscal year end and is not annualized if the reporting period covers less than 12 months. If a turnover rate is not shown, it typically indicates a
newly operational fund that has not yet been required to report turnover in its regulatory filings or, more rarely, the turnover rate was 0.00%.
# Holdings refers to the total number of individual security positions held in a portfolio on a given date.
©2015 Teachers Insurance and Annuity Association of America-College Retirement Equities Fund (TIAA-CREF), 730 Third Avenue, New
York, NY
Continued
on10017
next page…
C26455
INT-Rev 2 10/15/2015 9:22:55 PM 7430


