PHOTOELECTRON SPECTROSCOPY
Background Information:
In photoelectron spectroscopy (PES), one can determine the identity of a substance by measuring the amount of
energy needed to remove electrons from the substance’s component electrons. For the purposes of AP
Chemistry, we will only be considering the atoms of one element at a time.
If photons of great enough energy are used, ANY electron in the atom is vulnerable to being ionized, not just
the “least tightly bound” ones. A PES “spectrum” will end up showing the ionization energies of every
electron in a given atom, as well as the relative abundances of electrons with a given IE.
The “trick” is how to determine those ionization energies.
Well, if the Energy of the photon (Ephoton) is known, all we need to do is to determine the kinetic energy of a
given, ejected electron (KEelectron) . The difference between those two energies MUST be the energy needed to
“dislodge” the electron from it’s nucleus. IEelectron = Ephoton - KEelectron
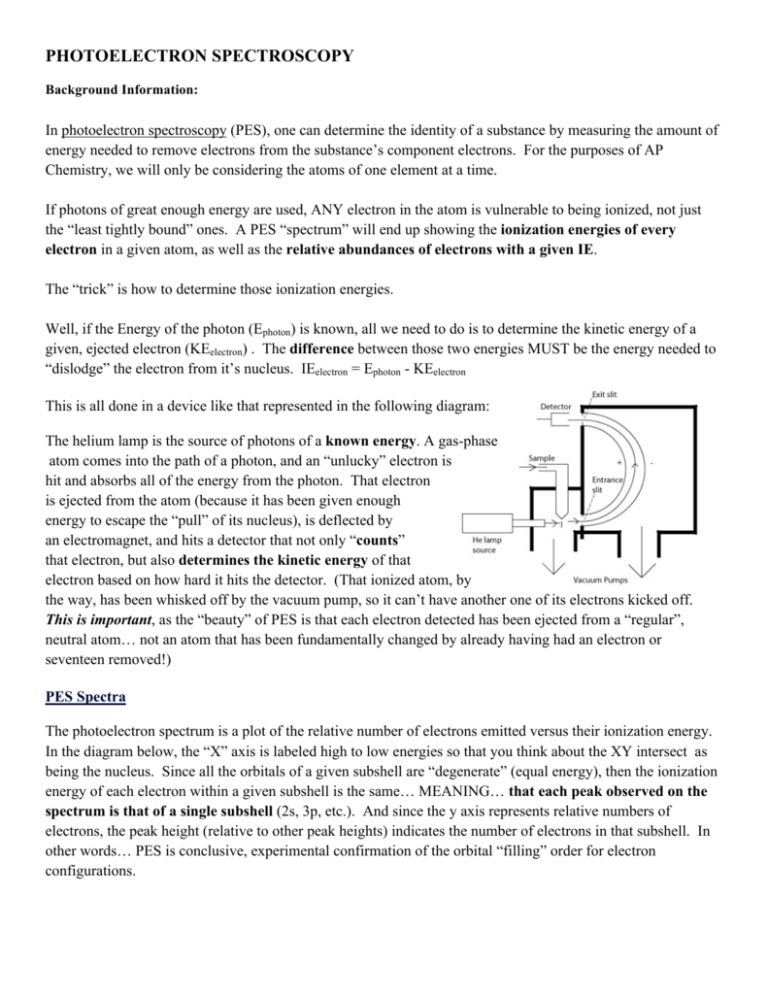
This is all done in a device like that represented in the following diagram:
The helium lamp is the source of photons of a known energy. A gas-phase
atom comes into the path of a photon, and an “unlucky” electron is
hit and absorbs all of the energy from the photon. That electron
is ejected from the atom (because it has been given enough
energy to escape the “pull” of its nucleus), is deflected by
an electromagnet, and hits a detector that not only “counts”
that electron, but also determines the kinetic energy of that
electron based on how hard it hits the detector. (That ionized atom, by
the way, has been whisked off by the vacuum pump, so it can’t have another one of its electrons kicked off.
This is important, as the “beauty” of PES is that each electron detected has been ejected from a “regular”,
neutral atom… not an atom that has been fundamentally changed by already having had an electron or
seventeen removed!)
PES Spectra
The photoelectron spectrum is a plot of the relative number of electrons emitted versus their ionization energy.
In the diagram below, the “X” axis is labeled high to low energies so that you think about the XY intersect as
being the nucleus. Since all the orbitals of a given subshell are “degenerate” (equal energy), then the ionization
energy of each electron within a given subshell is the same… MEANING… that each peak observed on the
spectrum is that of a single subshell (2s, 3p, etc.). And since the y axis represents relative numbers of
electrons, the peak height (relative to other peak heights) indicates the number of electrons in that subshell. In
other words… PES is conclusive, experimental confirmation of the orbital “filling” order for electron
configurations.
Interpretations from the data:
Photoelectron Spectra for Potassium
1. Place “relative intensity” values on the y axis in the tables above.
2. Label each peak on the graphs above with the subshell each represents (1s, etc).
3. Which electron will be removed from a neutral atom of potassium to form K+? _______________
Explain, using the information provided by the above spectrum:
4. Superimpose your best estimate of what the PES spectrum of calcium would be on top of potassium’s
spectrum above. (Don’t forget to take into account that not only does calcium have one more electron than
potassium… it also has one more PROTON.)
5. The next question contains the actual ionization values for Calcium. Compare them to the values that you
assigned them in the last question. How did you do? Did you at least understand that all of calcium’s values
should be shifted LEFT of potassium’s values? (These questions are rhetorical. I will be giving you a chance
to explain why these values are shifted left in a later question.)
6. There are three basic “trends” that can be gleaned from the table below. What are they?
7. Why do you think the ionization energy for an electron in the 4s orbital in calcium greater than the ionization
energy of an electron in the 4s orbital in potassium?
8. What element could have the following spectrum? __________
9. Examine the graph below. (It is IMPORTANT to read the note that is right above the graph!)
a) Which subshell is represented by the 0.77 peak?________________
b) Which subshell is represented by the 0.63 peak? _______________
c) How sure are you about your answers to “a” and “b”? Did you write the electron configuration for
scandium and make sure that your answers correspond to what is known about scandium’s electronic
structure?
d) How can this graph be used as proof that the 4s subshell “fills” before the 3d subshell?
e)
Scandium loses two electrons when forming Sc2+. Which electrons are most likely to be removed?
Justify your answer:
10. Sketch a spectrum of bromine ( label the “Y” axis quantitatively but not the “X” )
PES questions from Russ Maurer
1. Below is the PES of sulfur, and a table of successive ionization energies. The energy scale for the PES is in MJ/mol (1 MJ = 1000
kJ). There is exactly one peak on this graph whose energy corresponds to an ionization energy in table 7.2. What is it? Why doesn't
anything else match up?
(From Brown et al., Chemistry the Central Science 12 ed., copyright Pearson Prentice Hall)
2. Here is a picture of the original Bohr model of lithium (Z=3), and next to it, the PES of lithium. Is there anything in the PES data
for this element that requires revision of the Bohr model? Explain.
3. Similarly, here is the original Bohr model of carbon and the corresponding PES. Is there anything in the PES data for this element
that requires revision of the Bohr model? Explain.
4. Here is a PES spectrum of boron (Z=5; blue) superimposed on that of fluorine (Z=9; pink)
a. Why are the fluorine peaks to the left of the boron peaks?
b. Why is there one peak in fluorine that is so much taller than all the others?
5. Below is shown the PES spectrum of sulfur (atomic number = 16).
a. Write the full electron configuration of sulfur.
b. Label each peak in the spectrum to show which subshell it represents (i.e., 1s, 2s, etc.)
c. On the spectrum, sketch in the relative locations and correct peak heights for the spectrum of aluminum
(atomic number = 13). By relative location, I mean correctly to the left or right of the same subshell peak in
the sulfur spectrum.
d. Draw a circle around the sulfur peak whose energy is equal to the first ionization energy of sulfur.

