•Project Analysis and Evaluation
advertisement
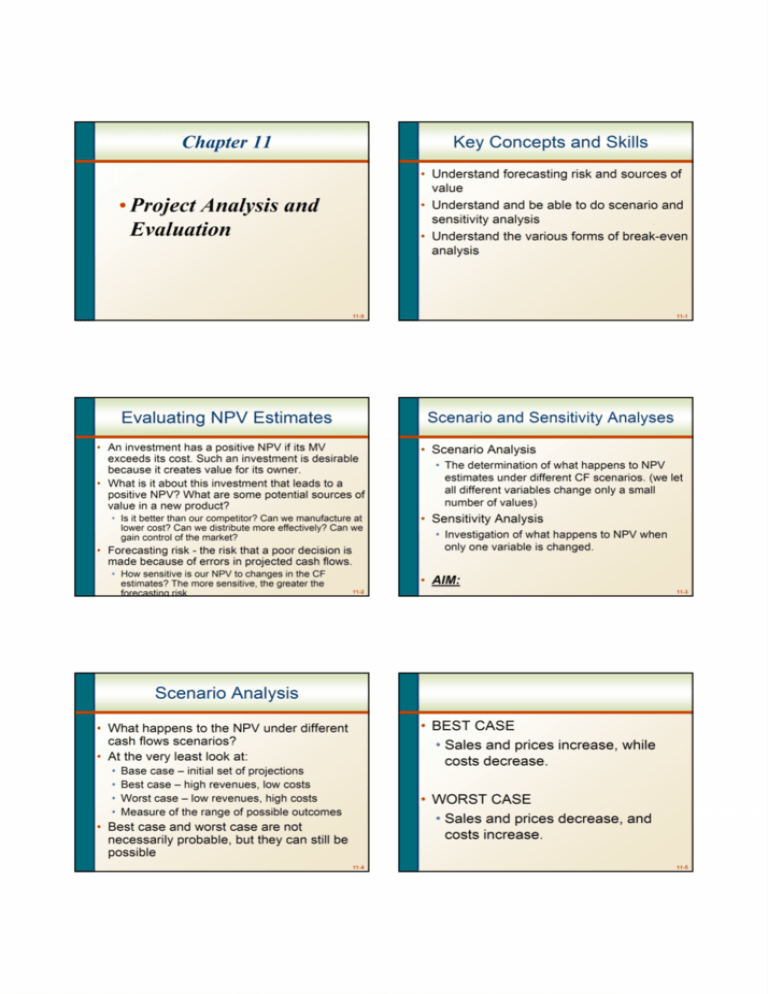
Chapter 11 Key Concepts and Skills • Understand forecasting risk and sources of value • Understand and be able to do scenario and sensitivity analysis • Understand the various forms of break-even analysis • Project Analysis and Evaluation 11-0 Evaluating NPV Estimates Scenario and Sensitivity Analyses • An investment has a positive NPV if its MV exceeds its cost. Such an investment is desirable because it creates value for its owner. • What is it about this investment that leads to a positive NPV? What are some potential sources of value in a new product? • Is it better than our competitor? Can we manufacture at lower cost? Can we distribute more effectively? Can we gain control of the market? • Forecasting risk - the risk that a poor decision is made because of errors in projected cash flows. • How sensitive is our NPV to changes in the CF estimates? The more sensitive, the greater the forecasting risk 11-1 • Scenario Analysis • The determination of what happens to NPV estimates under different CF scenarios. (we let all different variables change only a small number of values) • Sensitivity Analysis • Investigation of what happens to NPV when only one variable is changed. • AIM: 11-2 11-3 Scenario Analysis • BEST CASE • Sales and prices increase, while costs decrease. • What happens to the NPV under different cash flows scenarios? • At the very least look at: • • • • Base case – initial set of projections Best case – high revenues, low costs Worst case – low revenues, high costs Measure of the range of possible outcomes • WORST CASE • Sales and prices decrease, and costs increase. • Best case and worst case are not necessarily probable, but they can still be possible 11-4 11-5 Summary of Scenario Analysis for New Project Example 11.1: Senario Analysis • Consider a project. The initial cost is $200,000 and the project has a 5-year life. There is no salvage. Depreciation is straight-line, the required return is 12% and the tax rate is 34%. What is the base case NPV? What are the best and worst case senario NPVs? Base Case Unit Sales 6,000 Price/unit $ 80 Var. cost/unit $ 60 Fixed cost/year $ 50,000 Lower Bound 5,500 $ 75 $ 58 $ 45,000 Scenario Net Income Cash Flow NPV IRR Base case 19,800 59,800 15,567 15.1% Worst case -23,500 16,500 -140,521 -14.4% Best case 59,730 99,730 159,507 40.9% Upper Bound 6,500 $ 85 $ 62 $55,000 11-6 Sensitivity Analysis 11-7 Example 11.2: Sensitivity Analysis What happens to NPV when we vary one variable at a time? i.e. we are looking at the effect of specific variables on NPV. Consider the previous project (Example 1). How sensitive is OCF to changes in the quantity sold? • The greater the volatility in NPV in relation to a specific variable, the larger the forecasting risk associated with that variable and the more attention we want to pay to its estimation. 11-8 11-9 Summary of Sensitivity Analysis for New Project (Unit Sales) Sensitivity Analysis S e n s it iv it y A n a ly s is f o r U n it S a le s Scenario Unit Sales Cash Flow NPV IRR Base case 6000 59,800 15,567 15.1% 50000 40000 3 9 .3 5 7 30000 N PV 20000 Worst case 5500 53,200 -8,226 1 5 .5 6 7 10.3% 10000 19.7% -10000 0 5500 Best case 6500 66,400 39,357 6000 6500 N PV - 8 .2 2 6 -20000 U n it S a le s 11-10 11-11 Making a Decision Fix Costs and Variable Costs • At some point you have to make a decision • If the majority of your scenarios have positive NPVs, then you can feel reasonably comfortable about accepting the project. • If you have a crucial variable that leads to a negative NPV with a small change in the estimates, then you may want to give up the project. • There are two types of costs that are important in breakeven analysis: variable and fixed costs. • Variable Costs : Change as the quantity of output changes Total VC : Quantity * Cost per unit • (Eg. materials, labor, energy, packaging, sales commissions) • Fixed costs: are constant, regardless of output, over some time period • (Eg. administrative salaries, insurance, rent, property tax) • TOTAL COSTS: FC + VC FC + VC(Q) 11-12 Output Level and Total Cost 11-13 Average vs. Marginal Cost • Average Cost : TC / # of units • Will decrease as # of units increases • Marginal Cost • The cost to produce one more unit • Same as variable cost per unit 11-14 Example 11.3 11-15 Answer 11.3 • Your firm pays $3000 per month in fixed costs. You also pay $15 per unit to produce your product. First assume that you produce 1000 units and than assume that you produce 5000 units? • A) What is your total cost? • B) What is your average cost? • C) That is your marginal cost 11-16 11-17 Answer 11.3 Break-Even Analysis • B-E Analysis is a tool for analyzing the relationship between sales volume and profitability. • “How bad do sales have to get before we actually begin to lose money?” 11-18 11-19 Three Types of Break-Even Analysis Three Types of Break-Even Analysis • Accounting Break-Even (B-E) - The sales level that results in a net income of zero. • Accounting B-E gives managers an indication of how a project will impact accounting profit • If a project cannot B-E on an accounting basis, then it is not going to be a worthwhile project • Cash Break-even The sales level that results in a zero OCF. • Accounting Break-even • Where NI = 0 • Q = (FC + D) (P – v) • Include Depreciation • Cash Break-even (ignoring taxes) • Where OCF = 0 • Q = (FC + OCF) (P – v) • Exclude Depreciation • Financial Break-even • Financial Break-even The sales level that results in a zero NPV. How many does the company has to sell to B-E once we account for the 20% per year opportunity cost? 11-20 OCF and Sales Volume • Where NPV = 0 • Include the time value of money • Cash B-E < Accounting B-E < Financial B-E 11-21 11. 4 • Consider the following project • A new product requires an initial investment of $5 million and will be depreciated to an expected salvage of zero over 5 years • The price of the new product is expected to be $25,000 and the variable cost per unit is $15,000 • The fixed cost is $1 million • What is the accounting break-even point each year? 11-22 11-23 Answer 11.4 Example11.5: Break-Even Analysis • Consider the previous example. Assume a required return of 18%. What is the financial B-E point? i.e. What OCF (or payment) makes NPV = 0? 11-24 Answer 11.5 11-25 Example 11.6 • A project under consideration costs $ 750,000, has a five-year life, and has no salvage value. Depreciation is straight line to zero. The required return is 17%, and the tax rate is 34%. Sales are projected at 500 units per year. Price per unit is $2,500, variable cost per unit is $1,500, and fixed costs are $200,000 per year. 11-27 • A) Suppose you think that the unit sales, price, variable cost, and fixed costs projections given here are accurate to within 5%. What are the upper and lower bounds for these projections? What is the base case NPV? What are the best and worst case scenario NPVs? 11-28 • B) Given the base case projections in the previous problem, what are the cash, accounting and financial break even sales level for this project? Ignore taxes in answering. 11-29 Sugested Problems • 1-3, 7, 9, 10, 19.

