The Mathematics of Diversification
January 11, 2016
by Marc Odo
of Swan Global Investments
Although it is certainly possible to go overboard with the mathematics when it comes to portfolio
optimization, we will keep it simple and straightforward in this discussion.
When Harry Markowitz started an intellectual revolution with his seminal paper “Portfolio Selection” in
1952, one of his key contributions was quantifying the impact that correlations between pairs of
investments had on reducing a portfolio’s overall risk. The idea was that the contribution to overall
portfolio risk that a single investment brought to a portfolio was not just its weight in the portfolio, but
how it interacted with the other constituents of the portfolio.
This interaction is measured by correlation.
Technically speaking, correlation is a scaled version of covariance. Covariance measures how two
variables change in relationship to one another. Correlation normalizes covariance to a scale ranging
from -1.0 to +1.0.
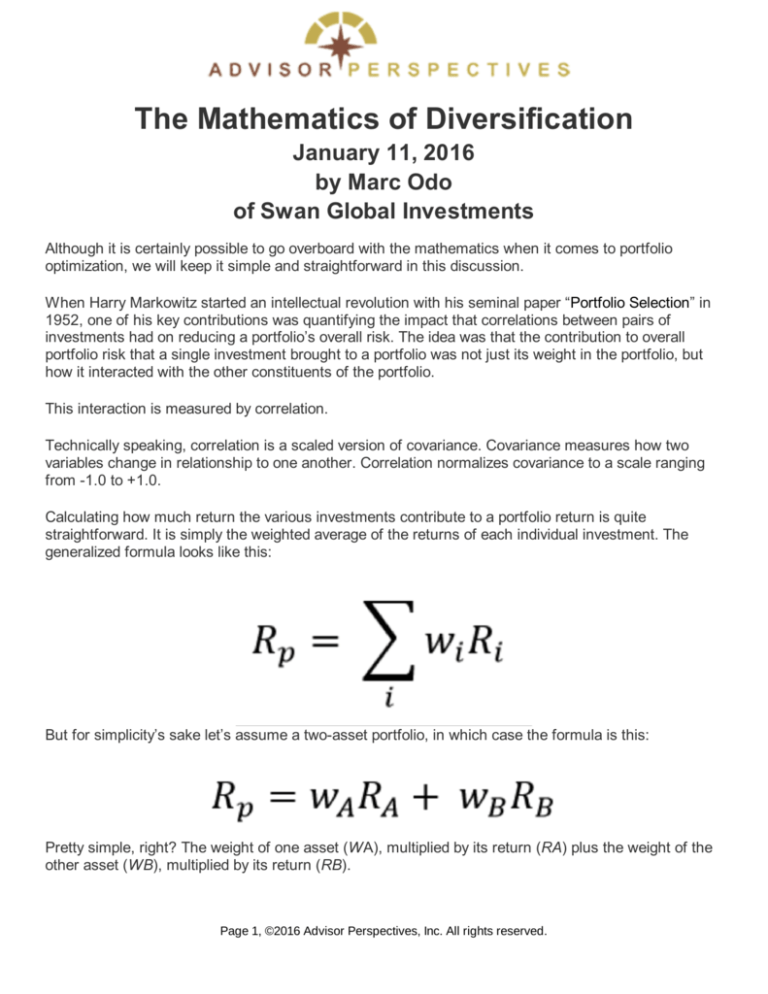
Calculating how much return the various investments contribute to a portfolio return is quite
straightforward. It is simply the weighted average of the returns of each individual investment. The
generalized formula looks like this:
But for simplicity’s sake let’s assume a two-asset portfolio, in which case the formula is this:
Pretty simple, right? The weight of one asset (WA), multiplied by its return (RA) plus the weight of the
other asset (WB), multiplied by its return (RB).
Page 1, ©2016 Advisor Perspectives, Inc. All rights reserved.
The formula for calculating an investment’s contribution of risk to a portfolio is more complicated, but
that’s actually a good thing. Correlation is the “X-factor” that has the potential to lower a portfolio’s
overall volatility. As before, “w” is the weight and the new terms “σ” and “ρ” signify the standard
deviation and covariance, respectively. The formula for a portfolio’s variance is:
Again, the generalized formula looks intimidating, but breaking it out in to a simple two-asset portfolio
makes it easier to understand.
The first two terms in the equation represent the stand-alone contribution of the risk of assets A and B
to the portfolio. Because the weights will be represented by a decimal and because they are being
squared, the impact of the standalone risk will always be less than the weight. For example, an 80%
weight squares out to .64, and a 40% weight squared would be .16.
This makes the third term, the combined risk of assets A and B, pretty important. The symbol for
correlation is highlighted in red. By working through the formula, it becomes evident just how important
that piece of the puzzle is.
If the correlation between A and B is 1.0, then overall variance is not reduced at all.
If the correlation between A and B is 0.0, the whole third term of the equation will be erased and
the variance of the portfolio will simply be the first two terms – a big improvement.
If correlations are negative, then the whole third term becomes negative, and we actually get to
subtract the third term from the first two.
That’s when risk reduction really comes in to play.
By walking through the formula above, we see how important correlation is to the overall risk equation.
Unfortunately, this is where most diversification strategies fall apart.
Although this post is based on mathematics, the old saying “a picture is worth a thousand words” holds
true. In the three illustrations below, we attempt to show the how high correlations fail to balance risk
and how low correlations help to even the scales.
Page 2, ©2016 Advisor Perspectives, Inc. All rights reserved.
As discussed in our previous blog post “Serving Up Diversification – The Importance of Correlations to
Diversification”, many investors pursued what we call “false diversification” strategies, where the
correlations might have been 0.80, 0.90, or higher. Plugging such numbers in to our formula above
does little to address overall portfolio risk.
Even if portfolios were built using asset classes or styles where the long-term correlations were low,
the unfortunate reality is that correlations spiked in the midst of a crisis. During a major market sell-off
the carnage tends to be widespread as panicked investors hit the “sell” button indiscriminately. The
benefits of diversification tend to evaporate right when they are most needed. In the example below we
Page 3, ©2016 Advisor Perspectives, Inc. All rights reserved.
see how some asset classes used for diversification purposes actually performed worse than the core
S&P 500 during major market downturns.
Source: Zephyr StyleADVISOR
Investors therefore need a way to deal with risk directly.
About the Author:
Marc Odo, CFA®, CAIA®, CIPM®, CFP®, Director of Investment Solutions, is responsible for helping
clients and prospects gain a detailed understanding of Swan’s Defined Risk Strategy, including how it
fits into an overall investment strategy. Formerly Marc was the Director of Research for 11 years at
Zephyr Associates.
Important Notes and Disclosures:
Swan Global Investments, LLC is a SEC registered Investment Advisor that specializes in managing
money using the proprietary Defined Risk Strategy (“DRS”). SEC registration does not denote any
special training or qualification conferred by the SEC. Swan offers and manages the DRS for investors
including individuals, institutions and other investment advisor firms. Any historical numbers, awards
and recognitions presented are based on the performance of a (GIPS®) composite, Swan’s DRS
Select Composite, which includes non-qualified discretionary accounts invested in since inception, July
1997, and are net of fees and expenses. Swan claims compliance with the Global Investment
Performance Standards (GIPS®). All data used herein; including the statistical information, verification
and performance reports are available upon request. The S&P 500 Index is a market cap weighted
Page 4, ©2016 Advisor Perspectives, Inc. All rights reserved.
index of 500 widely held stocks often used as a proxy for the overall U.S. equity market. Indexes are
unmanaged and have no fees or expenses. An investment cannot be made directly in an index. Swan’s
investments may consist of securities which vary significantly from those in the benchmark indexes
listed above and performance calculation methods may not be entirely comparable. Accordingly,
comparing results shown to those of such indexes may be of limited use. The adviser’s dependence on
its DRS process and judgments about the attractiveness, value and potential appreciation of particular
ETFs and options in which the adviser invests or writes may prove to be incorrect and may not produce
the desired results. There is no guarantee any investment or the DRS will meet its objectives. All
investments involve the risk of potential investment losses as well as the potential for investment gains.
Prior performance is not a guarantee of future results and there can be no assurance, and investors
should not assume, that future performance will be comparable to past performance. All investment
strategies have the potential for profit or loss. Further information is available upon request by
contacting the company directly at 970-382-8901 orwww.swanglobalinvestments.com. 065-SGI121715
© Swan Global Investments
Page 5, ©2016 Advisor Perspectives, Inc. All rights reserved.


