Individual Investigation (Edexcel Revision Guide)
advertisement

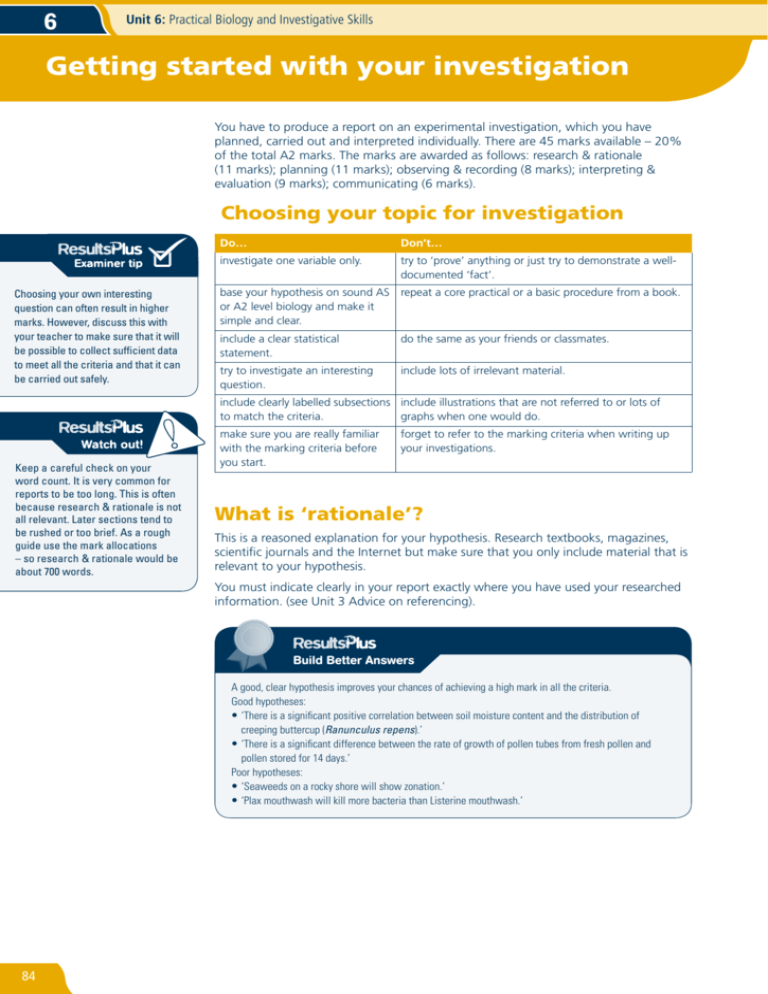
6 Unit 6: Practical Biology and Investigative Skills Getting started with your investigation You have to produce a report on an experimental investigation, which you have planned, carried out and interpreted individually. There are 45 marks available – 20% of the total A2 marks. The marks are awarded as follows: research & rationale (11 marks); planning (11 marks); observing & recording (8 marks); interpreting & evaluation (9 marks); communicating (6 marks). Choosing your topic for investigation Choosing your own interesting question can often result in higher marks. However, discuss this with your teacher to make sure that it will be possible to collect sufficient data to meet all the criteria and that it can be carried out safely. Do… Don’t… investigate one variable only. try to ‘prove’ anything or just try to demonstrate a welldocumented ‘fact’. base your hypothesis on sound AS repeat a core practical or a basic procedure from a book. or A2 level biology and make it simple and clear. include a clear statistical statement. do the same as your friends or classmates. try to investigate an interesting question. include lots of irrelevant material. include clearly labelled subsections include illustrations that are not referred to or lots of to match the criteria. graphs when one would do. Keep a careful check on your word count. It is very common for reports to be too long. This is often because research & rationale is not all relevant. Later sections tend to be rushed or too brief. As a rough guide use the mark allocations – so research & rationale would be about 700 words. make sure you are really familiar with the marking criteria before you start. forget to refer to the marking criteria when writing up your investigations. What is ‘rationale’? This is a reasoned explanation for your hypothesis. Research textbooks, magazines, scientific journals and the Internet but make sure that you only include material that is relevant to your hypothesis. You must indicate clearly in your report exactly where you have used your researched information. (see Unit 3 Advice on referencing). Build Better Answers A good, clear hypothesis improves your chances of achieving a high mark in all the criteria. Good hypotheses: • ‘There is a significant positive correlation between soil moisture content and the distribution of creeping buttercup (Ranunculus repens).’ • ‘There is a significant difference between the rate of growth of pollen tubes from fresh pollen and pollen stored for 14 days.’ Poor hypotheses: • ‘Seaweeds on a rocky shore will show zonation.’ • ‘Plax mouthwash will kill more bacteria than Listerine mouthwash.’ 84 6 Planning Your report must give clear evidence of how you have thought about and developed an effective and safe method to test your hypothesis. You need to use a simple trial experiment to do this. Making sure you collect valid and reliable data Always ensure you are really testing your chosen hypothesis. • ‘Make a clear plan of action including a trial experiment. This should explain what materials you intend to use and details of quantities and concentrations, etc. You also need to show exactly how you are going to use your trial to develop the final method. • Decide how your data is to be analysed before data collection, not later. For example chose your statistical test and number of repeat measurements in advance. • Include a separate section for discussion of possible variables and how you intend to control them or take them into account. Considering variables It is unlikely that you will be able to control every single variable but you must show that you have considered all the important factors that could affect your results and that your planned investigation will yield some scientifically meaningful data. (a) In the laboratory You should be able to control most variables here but even if apparatus is limited, use what is available, for example, you may not have a thermostatic water bath but you could use a beaker of water to hold temperature constant. Beware of making your own judgements of things like colour changes, try to devise a method that will help you to be consistent. Trial experiments are an ideal way to do this. (b) In the field Many variables are more difficult to control in the field but they still need careful consideration. Select your sampling sites carefully to make sure you do not introduce more variables. Measuring some abiotic factors can help to ensure they are not affecting the results. Risk assessment You must show that your investigation can be carried out safely by including a risk assessment. The diagram below shows one approach to this assessment. List all procedures and chemical compounds used. What risks are associated with each? Can the risks be eliminated? Yes Change planned method. Poorly planned data collection can lead to the completion of many statistical tests or graphs which do not actually relate to the hypothesis you are testing. This can limit marks in planning and in interpreting & evaluation. No What precautions must be taken to reduce risk to a safe level? 85 6 Unit 6: Practical Biology and Investigative Skills Planning – trial investigations The following are good examples of how to use a trial experiment to change your method: ‘The clear areas of agar were not circular so I decided to trace them on graph paper and measure the area by counting squares.’ ‘It is obvious from my table that there was only a very small difference in my results when I increased the concentration by 1% each time. I changed this to 5% each time so that the effect was much more obvious.’ ‘The stream I was using had lots of areas which were shaded by large trees and the depth of water was quite different in some parts. I searched further downstream until I found an unshaded section with an even depth but there was a pool with slow-flowing water and a narrower section with a faster moving stream.’ Don’t write a detailed method twice. You can achieve high marks by writing this once then listing any amendments you make, with reasons, after your trial. 86 Make sure that your trial experiment is an important part of your planning, not just an exercise to justify what you have already decided. In order to gain high marks you will need to show that you have used the results of a trial to amend and develop your method. Simply following instructions or copying a common experiment from a book will only gain a few marks. The trial does not have to be extensive but it should produce some evidence or simple data that you can use to explain any modifications you make. If you are working in the laboratory you must try out your method and check to see if you can obtain the results you need. If you are working in the field you must visit the site and try out your sampling technique. Some important questions for trial experiments (a) In the laboratory • Is your chosen range of values suitable? • How accurately can you take measurements? Is there anything that can be done to make your measurements more accurate and reliable? • Are there any variables that you have not taken into account? (b)In the field • Is the whole of the selected site suitable? • Do you need to choose sampling sites to avoid introducing other variables? • Can you identify the important species? • Does your proposed sampling method allow you to collect sufficient data? 6 Observing and recording Make sure you record your data in a clear table, using the correct SI units and at a level of accuracy that is sensible bearing in mind the methods you use. Tabulation Significant figures • Use clear, accurate headings including units. • Put units in the headings only, not with individual readings. • Make sure there is a clear summary table showing the values used to draw your graph. • Use a consistent number of significant figures for all data (including manipulated figures such as means). • Remember to use zeros (2 is not the same as 2.00). • Do not use numbers of significant figures that cannot be justified by your method. A simple way to apply this rule is not to use a greater number of significant figures than shown in your actual measurements. Types of graph There are a surprising number of basic errors in selecting and drawing graphs of a suitable type, so give this some careful thought, starting with basic principles: • Normally there should be only one or two graphs. • Your graph needs to be directly linked to your hypothesis and help you to make conclusions from your data. • Axes should have clear, accurate labels with appropriate SI units where possible. • Lines of ‘best fit’ are not a requirement at A2 level and should normally be avoided. • Most simple line graphs are best presented by joining points accurately with a ruler. • It is better to leave a scattergram without a line rather than draw one by guesswork. • Avoid using ‘sample number’ as an axis. This is almost always meaningless when attempting to analyse trends and patterns in data and especially when random sampling has been used. A very common mistake is to record time from a stopwatch as a decimal or as two units. Recording 2 min 50 s as 2.5 min instead of 2.83 min or 170 s is a very large error. Presenting data to help analysis If you are looking for significant differences in your investigation, you may have two sets of samples from which you would calculate two means. This might lead to a very simple two-column bar graph, which would give you only limited information on which to make detailed comments. However, selecting suitable size classes for each data set and then plotting a histogram for each on the same axes would allow you to comment on such things as the spread of data, any overlap and skewed distribution. 35 Key shaded area 600 unshaded area 25 500 20 400 Mean leaf area/mm2 Total number of leaves 30 15 10 300 200 100 5 0 0 0–99 100–199 200–299 300–399 400–499 500–599 600–699 700–799 Area of leaf/mm2 unshaded area shaded area 87 6 Unit 6: Practical Biology and Investigative Skills Dealing with data Hypothesis testing using statistics Imagine you are taking random samples from two areas and you wish to decide whether they are different. To make this decision scientifically you need to follow these rules: 1Begin by assuming that the averages of the two samples are the same. This is a null hypothesis. 2 Take samples from each area. 3It is very unlikely the averages will be identical so you can calculate the chance (probability) of obtaining results like yours, even if the two samples were not really different, using a statistical test. 4If the chance (probability) calculated is higher than the significance level then you must accept that your first assumption is correct and there is no difference. If the chance of getting these results is lower than the significance level then you would reject the null hypothesis. Examples of null hypotheses •There is no significant difference in the numbers of mayfly nymphs found in slowflowing streams and fast-flowing streams. •There is no significant correlation between the abundance of creeping buttercup and soil moisture content. Significance levels In most investigations you should use a significance level of 5%. This means there are 5 chances in 100 that the results you obtain could occur even if there was no difference between the two sets of data. This can be written as a probability of p=0.05. To find this value for your data you normally have to calculate a test statistic and then look up the probability in a published table. Statistical tests You are not expected to know the formulae or fine details of each test. You should concentrate on selecting the correct type of test and demonstrating your understanding of how to interpret the results. The three types of test you are most likely to consider are: • tests for significant difference e.g. t-test or Mann Whitney U test • test for significant correlations e.g. Spearman’s Rank Correlation test • tests for significant association or ‘goodness of fit’ e.g. Chi Squared test Other statistical terms You cannot achieve more than 4/5 marks if you do not explain the results of your statistical test in your own words. You can use a computer programme to calculate the test statistic but not to explain its meaning. 88 You are also expected to understand the following terms where applicable: • arithmetical mean (average) – the sum of all the measurements divided by the number of measurements •median – the middle value of your data where half the sample measurements are above this value and half are below •mode – the measurement which occurs the greatest number of times in your sample. 6 Interpreting and evaluating Conclusions It is vital that you begin by describing accurately the trends and patterns shown by your data. At this stage do not be influenced by theoretical expectations. The next stage is to try to interpret your results using biological principles. This does not mean simply adding a lot of biological theory. You must use your biological knowledge and link it very clearly to your data. Limitations It is expected that you will take an objective, critical look at the method you have used and assess how it might affect the reliability of your conclusions. The important question to ask yourself is ‘no matter how carefully I carry out this investigation what factors could still cause variations in my repeat readings?’ Build Better Answers Avoid terms such as ‘proves that’ or ‘shows that’. Use more cautious terms such as ‘supports the hypothesis that’ or ‘agrees with the suggestion that’. Build Better Answers Poor limitations: •admissions of practical incompetence when describing limitations •suggestions of limitations that should have been eliminated by sensible planning or a trial experiment. Good limitations: •‘I set up a series of colour standards to make my judgement of the end-point as accurate as possible but this was still very subjective. It would be more accurate to filter my samples and use a colorimeter to give a precise measurement.’ Sensible modifications This section should follow from your analysis of limitations. If you have identified factors which could cause variations then what modifications could be made to your method to minimise their effect? Don’t: •simply suggest taking more samples – you should have thought about this in planning and just doing more of the same will not normally improve your method • modify your investigation so that it begins to test a completely different hypothesis. Communicating High-scoring reports always make it clear where each of the criteria has been addressed by using sub-headings. This will prevent you omitting important details or repeating yourself. Use the advice given in other parts of this section of Unit 6 to tabulate your results accurately and choose the right form of graph. Keep your sentences short but accurate and use a spelling check, especially for scientific terms. You will be given credit for selecting information from sources in ‘research & rationale’ but for higher marks you must use at least one professional journal and list all your sources in a bibliography, identifying where in your report each has been used. For the highest marks you will need to evaluate your chosen sources, describing their credibility to scientists as a whole. 89


