One of a series of fact sheets on economic issues for communities
How can I learn more about visitors to my Web
site?
Tip: Use Web analytic software to gather information about
your customers and patrons
If you’re part of a small business or other organization, you probably know that analyzing
the traffic to your Web site or blog is one of the best ways to learn more about your
clientele so you can serve them better. But how do you get that information?
The answer is Web analytics—the measurement, collection, analysis and reporting of
Internet data to help you optimize traffic to your Web site or blog. Even more important,
Web analytics can assist you with business and market research to improve your products
and services. Web analytics can help you learn more about the visitors to your Web site
or blog so you can make better decisions.
There are various brands of Web analytic software on the market today, including Google
Analytics, which we will focus on in this fact sheet. We chose Google Analytics because
it’s free and relatively easy to understand. However, we strongly recommend that you
check out other Web analytic products to find the one that best suits your needs and
budget. You can find a list on Wikipedia at
http://en.wikipedia.org/wiki/List_of_web_analytics_software
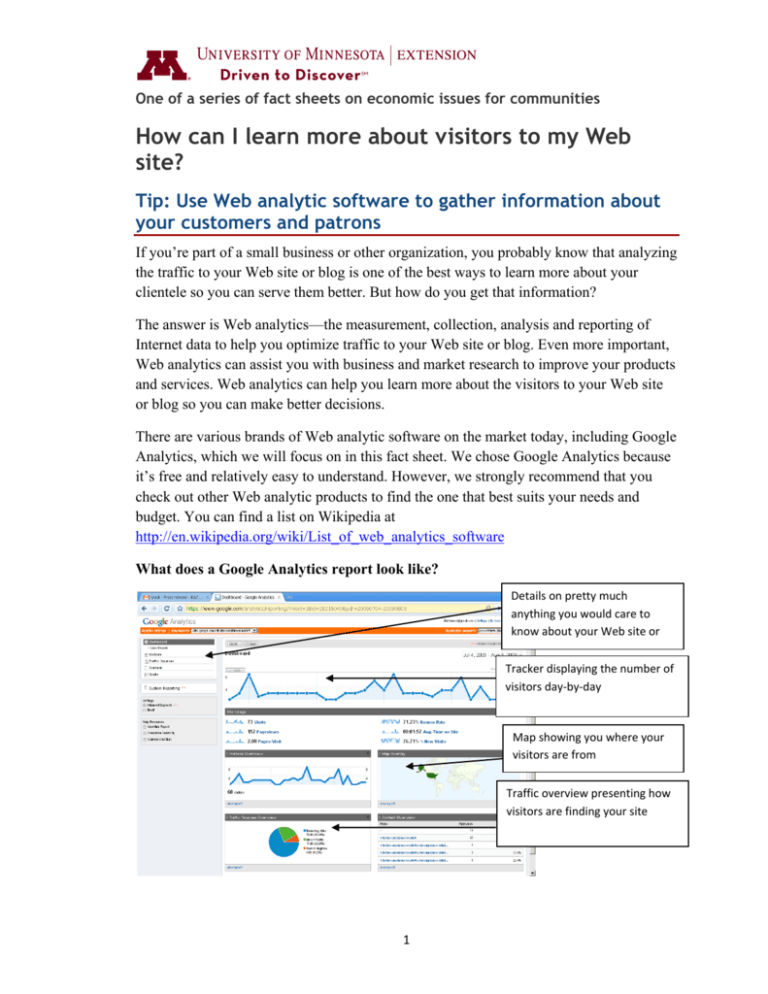
What does a Google Analytics report look like?
Details on pretty much anything you would care to know about your Web site or Tracker displaying the number of visitors day‐by‐day Map showing you where your visitors are from Traffic overview presenting how visitors are finding your site 1 Where does Google Analytics fit into my organization?
Although Google Analytics can deliver a wide variety of statistics, you need to focus
only on those you need. This requires identifying your Web presence goals (if you
haven’t already created them), then using the software to track your progress in those
specific areas (Inc. magazine, 2008). Start by asking, “What am I trying to accomplish
with my Web site or blog?” Your answers will be your goals.
Many organizations have a primary goal to attract more clientele via their Web site, but
you might have secondary or more specific goals, too, such as “I want to increase sales to
customers from nearby towns.” Google Analytics can help, starting with basic statistics
on how many visitors your Web sites gets in a day, a week, a month, a year—whatever
time span you choose.
Google Analytics also can analyze data at a deeper level, providing reports on which key
words visitors use to find your site, the zip codes where they live, which pages they visit
the most and how long they stay there. Google Analytics also is capable of analyzing
sophisticated e-commerce sites—tracking how visitors navigate the site from landing
page to final purchase.
In short, Google Analytics provides valuable intelligence you can use to make changes to
attract more visitors to your Web site, and ultimately, more customers or patrons. You
need to decide what level of data you need to meet your goals. Don’t get carried away, though. Information overload is a real danger, especially to small
organizations with few people on staff. Greg Sterling, an Internet analyst with Opus
Research, estimates that less than 10 percent of small businesses check their Web
analytics findings due to feeling “overwhelmed” (CRM Magazine, 2009). Even managers
of large corporations do not use a majority of the information their Web analytics
software is capable of providing (Forrester, 2009). It’s best to start slow with Google
Analytics, or any other Web analytics tool—use it only to track one or two pieces of
information first, then expand your use later.
What are some more examples of how I could use Google Analytics?
1. Detect the effect of advertising
Gauging the effectiveness of traditional advertising (print, radio, television) can
be difficult. For example, did your recent newspaper ad draw more customers to
your store or was it simply the good weather? Asking customers directly through
a survey is probably the only way to get a definitive answer to that question. But
Google Analytics can give you some sense of the ad’s impact when you
2 incorporate your Web address into your ad, then check the number of visitors to
your Web site in the days immediately after the ad appears.
2. Diagnose Web site usability problems
Organizations and businesses can learn about the quality of their Web sites
through monitoring statistics like the bounce rate and time spent on individual
Web pages. Bounce rate refers to the percentage of visitors who leave the first
page they land on (without going to others). If your bounce rate is high and time
spent on the site is low, visitors might not find the information useful or they’re
confused about how to get to other pages on your site. In that case, you’ll
probably want to consider changing your content or your site navigation.
3. Inform online advertising
Google Analytics also reports use of Adwords, Google’s online advertising
system. Adwords, and other online advertising systems, charge on a “pay-perclick” basis. This requires businesses and other organizations to pay each time a
Web visitor clicks on their ad. Although this sounds risky and costly, advertisers
actually have a great deal of control over the timing, frequency, and cost of their
ads. For example, if you operate an ice cream parlor, you can choose to limit your
ads only to those visitors who use the keywords “ice” and “cream” and are
searching from the zip codes “56572 and “56573.” Tracking which keywords are
driving traffic to your site and where those visitors live allows you to properly
target your potential customers.
4. Identify partnership opportunities
Another important metric measured by Google Analytics is referral page
information. This is information about other Web sites or blogs referring visitors
to your site. Referrals might come from your local chamber’s Web site, a
customer blog, or another business Web site. This information is invaluable to
forming new strategic partnerships to cross-promote or cooperatively market so
all partners benefit. At the very least your business or organization can return the
favor to your top referrers by adding a link to their Web sites from yours.
How do I get started?
Erica Akela, Web analyst with Xerox Direct who does Web analysis daily, advises five
steps to get up and running on Google Analytics (E. Akela, personal communication,
February 23, 2010):
1. Sign up for Google Analytics at http://www.google.com/analytics/
Create a Google account.
Place code on your Web site, as instructed.
3 2. Verify that Google Analytics is gathering data and that everything is in order 24
to 48 hours after registering.
3. Wait at least a week to gather enough data for analysis.
4. Begin to collect “benchmark” data, e.g., average visitors and sales by day, week,
or month, and so on.
5. Set goals to provide a context for the data and take necessary action. For example,
if your goal is 3,000 visitors to your Web site daily but only have 500, you’ll need
to find ways to increase traffic. Of, if you offer a Web form and discover people
quit halfway through completing it, you will need to modify the form.
The support pages for Google Analytics are very accessible. Check out the Getting
Started Guide at http://www.google.com/support/analytics/ to begin exploring. What’s the bottom line?
Google Analytics and other brands of Web analytics software are valuable tools, many of
which are free or low-cost, for conducting business and market research. Web analytics
provide valuable information about customers and patrons that businesses and
organizations can use to improve their products and services. This fact sheet provides a
starting point to using Web analytics software. With your business or organization’s
goals in mind, we suggest you learn more about what Web analytics software can do to
help you achieve those goals.
References
Chafkin, M. (2008, November). Improving your sense of site. Inc. magazine. 30 (11), 3537.
Forrester Consulting (2009, September). Appraising your investments in enterprise web
analytics [PDF document]. Retrieved from: http://www.google.com/analytics
Tsai, J. (2009, August). X marks the spot. CRM magazine. 13 (8), 23-24.
Fact sheet prepared by Ryan Pesch, Extension Educator, Community Economics,
March, 2010
________________________________________________________________________
© 2010 Regents of the University of Minnesota. All rights reserved.
The University of Minnesota is an equal opportunity educator and employer.
www.extension.umn.edu
4


