Problem Set 2: The Basic H
advertisement
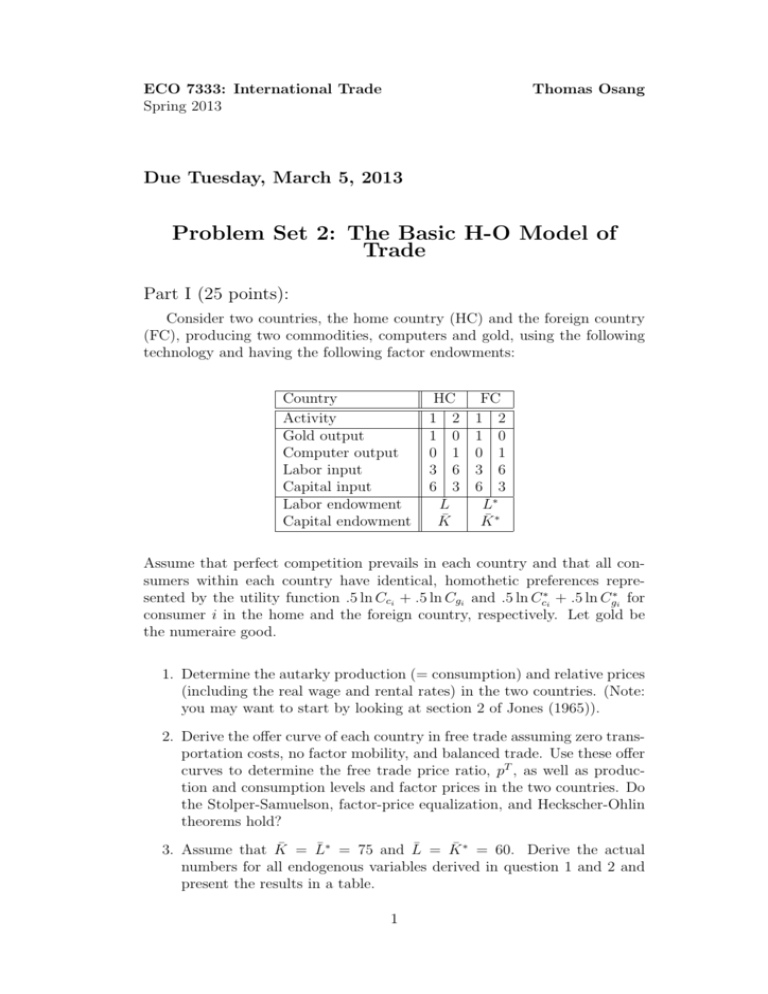
ECO 7333: International Trade Spring 2013 Thomas Osang Due Tuesday, March 5, 2013 Problem Set 2: The Basic H-O Model of Trade Part I (25 points): Consider two countries, the home country (HC) and the foreign country (FC), producing two commodities, computers and gold, using the following technology and having the following factor endowments: Country Activity Gold output Computer output Labor input Capital input Labor endowment Capital endowment HC 1 2 1 0 0 1 3 6 6 3 L̄ K̄ FC 1 2 1 0 0 1 3 6 6 3 L̄∗ K̄ ∗ Assume that perfect competition prevails in each country and that all consumers within each country have identical, homothetic preferences represented by the utility function .5 ln Cci + .5 ln Cgi and .5 ln Cc∗i + .5 ln Cg∗i for consumer i in the home and the foreign country, respectively. Let gold be the numeraire good. 1. Determine the autarky production (= consumption) and relative prices (including the real wage and rental rates) in the two countries. (Note: you may want to start by looking at section 2 of Jones (1965)). 2. Derive the offer curve of each country in free trade assuming zero transportation costs, no factor mobility, and balanced trade. Use these offer curves to determine the free trade price ratio, pT , as well as production and consumption levels and factor prices in the two countries. Do the Stolper-Samuelson, factor-price equalization, and Heckscher-Ohlin theorems hold? 3. Assume that K̄ = L̄∗ = 75 and L̄ = K̄ ∗ = 60. Derive the actual numbers for all endogenous variables derived in question 1 and 2 and present the results in a table. 1 4. Draw a diagram for each country showing the autarky equilibrium for the specific numbers in 3. 5. Continuing to assume free trade, suppose the labor endowment of the foreign country increases to 120. What would be the new output pattern of the foreign country? Does the change conform to the Rybczynski theorem? Part II (25 points): Now suppose that the technology available to the two countries allows for substitution between capital and labor. Specifically, we replace our linear 2 1 activities with neoclassical production functions: Qg = 13 12 Kg3 Lg3 , Qc = 1 1 3 2 23 1 3 23 2 3 Kc Lc . Everything else from part I remains the same. 1. Express kg , kc , and p as functions of the wage-rent ratio ω. 2. Draw the Samuelson diagram showing kg , kc , and p as function of the wage-rent ratio ω. 3. Without deriving offer curves, show that the free trade equilibrium is the same as in part I. (Hint: set the free trade price ratio equal to the result in part I, and then show that, for the endowments given in question 3 of part I, all of the other variables are also equal to the results in part I.) Can you explain this surprising equality? 4. Show the free trade equilibrium on the Samuelson diagram from section 1. 5. Derive the cone of incomplete specialization. (a) Find the ratio between the home country’s capital-labor endowment ratio, k, and the foreign country’s capital-labor endowment ∗ ratio, k , for which the two countries are on the borderline between incomplete and complete specialization. (Recall that there are two ratios - one where the home country is the capital abundant country and the other where the foreign country is the capital abundant country.) ∗ (b) Plot these ratios on a diagram that measures k on the horizontal axis and k on the vertical axis. (c) Do the endowments given in question 3 of part I lie within the cone? 6. Extra Credit (10 points): Can you derive a closed-form solution for the free trade price ratio? Explain. 2
