Reading Profiles and Fatigue Ratings in Children with
advertisement
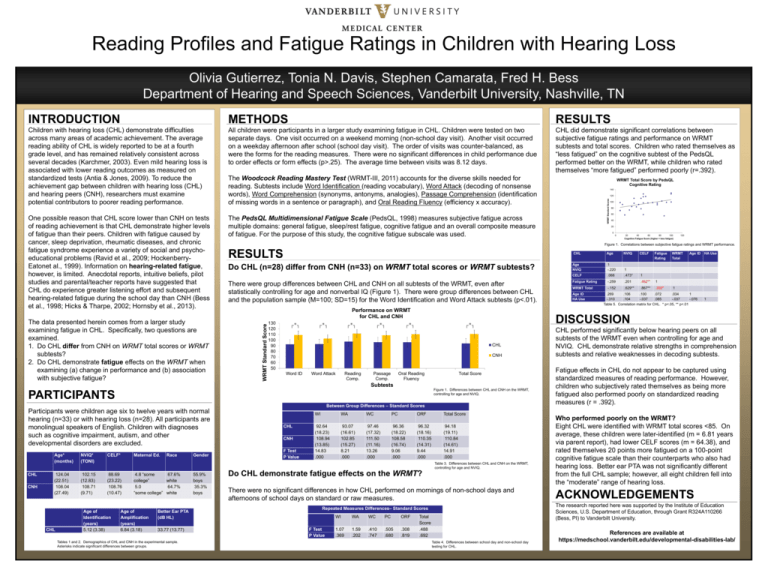
Reading Profiles and Fatigue Ratings in Children with Hearing Loss Olivia Gutierrez, Tonia N. Davis, Stephen Camarata, Fred H. Bess Department of Hearing and Speech Sciences, Vanderbilt University, Nashville, TN INTRODUCTION METHODS RESULTS Children with hearing loss (CHL) demonstrate difficulties across many areas of academic achievement. The average reading ability of CHL is widely reported to be at a fourth grade level, and has remained relatively consistent across several decades (Karchmer, 2003). Even mild hearing loss is associated with lower reading outcomes as measured on standardized tests (Antia & Jones, 2009). To reduce the achievement gap between children with hearing loss (CHL) and hearing peers (CNH), researchers must examine potential contributors to poorer reading performance. All children were participants in a larger study examining fatigue in CHL. Children were tested on two separate days. One visit occurred on a weekend morning (non-school day visit). Another visit occurred on a weekday afternoon after school (school day visit). The order of visits was counter-balanced, as were the forms for the reading measures. There were no significant differences in child performance due to order effects or form effects (p>.25). The average time between visits was 8.12 days. CHL did demonstrate significant correlations between subjective fatigue ratings and performance on WRMT subtests and total scores. Children who rated themselves as “less fatigued” on the cognitive subtest of the PedsQL performed better on the WRMT, while children who rated themselves “more fatigued” performed poorly (r=.392). The data presented herein comes from a larger study examining fatigue in CHL. Specifically, two questions are examined. 1. Do CHL differ from CNH on WRMT total scores or WRMT subtests? 2. Do CHL demonstrate fatigue effects on the WRMT when examining (a) change in performance and (b) association with subjective fatigue? CHL CNH 124.04 (22.51) 108.04 (27.49) 102.15 (12.83) 108.71 (9.71) 88.69 (23.22) 108.76 (10.47) CHL Maternal Ed. Race Gender Age of Identification (years) 5.12 (3.38) Age of Amplification (years) 6.84 (3.18) Better Ear PTA (dB HL) 33.77 (13.77) Tables 1 and 2. Demographics of CHL and CNH in the experimental sample. Asterisks indicate significant differences between groups. 55.9% boys 35.3% boys WRMT Standard Scores 60 40 20 0 0 20 40 60 80 100 Cognitive Fatigue Score (higher = less fatigue) RESULTS Do CHL (n=28) differ from CNH (n=33) on WRMT total scores or WRMT subtests? Age NVIQ 1 -.220 1 CELF .068 .473* 1 Fatigue Rating -.259 .201 .462** 1 WRMT Total -.152 .629** .867** .392* There were group differences between CHL and CNH on all subtests of the WRMT, even after statistically controlling for age and nonverbal IQ (Figure 1). There were group differences between CHL and the population sample (M=100; SD=15) for the Word Identification and Word Attack subtests (p<.01). Performance on WRMT for CHL and CNH 120 CHL CNH Word ID Word Attack Reading Comp. Passage Comp. CHL CNH F Test P Value Oral Reading Fluency Total Score WI WA WC PC ORF Total Score 92.64 (18.23) 108.94 (13.85) 14.83 .000 93.07 (16.61) 102.85 (15.27) 8.21 .000 97.46 (17.32) 111.50 (11.16) 13.26 .000 96.36 (18.22) 108.58 (16.74) 9.06 .000 96.32 (18.16) 110.35 (14.31) 9.44 .000 94.18 (19.11) 110.84 (14.61) 14.91 .000 Do CHL demonstrate fatigue effects on the WRMT? There were no significant differences in how CHL performed on mornings of non-school days and afternoons of school days on standard or raw measures. F Test P Value WA WC PC ORF 1.07 .369 1.59 .202 .410 .747 .505 .680 .308 .819 Fatigue Rating WRMT Total Age ID HA Use 1 .269 .106 .100 .072 .034 1 -.310 .104 -.037 .085 -.037 -.076 Table 5. Correlation matrix for CHL. * p<.05, ** p<.01 1 CHL performed significantly below hearing peers on all subtests of the WRMT even when controlling for age and NVIQ. CHL demonstrate relative strengths in comprehension subtests and relative weaknesses in decoding subtests. Fatigue effects in CHL do not appear to be captured using standardized measures of reading performance. However, children who subjectively rated themselves as being more fatigued also performed poorly on standardized reading measures (r = .392). Who performed poorly on the WRMT? Eight CHL were identified with WRMT total scores <85. On average, these children were later-identified (m = 6.81 years via parent report), had lower CELF scores (m = 64.38), and rated themselves 20 points more fatigued on a 100-point cognitive fatigue scale than their counterparts who also had hearing loss. Better ear PTA was not significantly different from the full CHL sample; however, all eight children fell into the “moderate” range of hearing loss. ACKNOWLEDGEMENTS The research reported here was supported by the Institute of Education Sciences, U.S. Department of Education, through Grant R324A110266 (Bess, PI) to Vanderbilt University. Repeated Measures Differences– Standard Scores WI Age ID HA Use CELF DISCUSSION 130 120 110 100 90 80 70 60 50 Table 3. Differences between CHL and CNH on the WRMT, controlling for age and NVIQ. 4.8 “some 67.6% college” white 5.0 64.7% “some college” white 80 NVIQ Between Group Differences – Standard Scores CELF* 100 Age PARTICIPANTS NVIQ* (TONI) 120 CHL Figure 1. Differences between CHL and CNH on the WRMT, controlling for age and NVIQ. Age* (months) 140 Figure 1. Correlations between subjective fatigue ratings and WRMT performance. Subtests Participants were children age six to twelve years with normal hearing (n=33) or with hearing loss (n=28). All participants are monolingual speakers of English. Children with diagnoses such as cognitive impairment, autism, and other developmental disorders are excluded. WRMT Total Score by PedsQL Cognitive Rating The PedsQL Multidimensional Fatigue Scale (PedsQL, 1998) measures subjective fatigue across multiple domains: general fatigue, sleep/rest fatigue, cognitive fatigue and an overall composite measure of fatigue. For the purpose of this study, the cognitive fatigue subscale was used. WRMT Standard Score One possible reason that CHL score lower than CNH on tests of reading achievement is that CHL demonstrate higher levels of fatigue than their peers. Children with fatigue caused by cancer, sleep deprivation, rheumatic diseases, and chronic fatigue syndrome experience a variety of social and psychoeducational problems (Ravid et al., 2009; HockenberryEatonet al., 1999). Information on hearing-related fatigue, however, is limited. Anecdotal reports, intuitive beliefs, pilot studies and parental/teacher reports have suggested that CHL do experience greater listening effort and subsequent hearing-related fatigue during the school day than CNH (Bess et al., 1998; Hicks & Tharpe, 2002; Hornsby et al., 2013). The Woodcock Reading Mastery Test (WRMT-III, 2011) accounts for the diverse skills needed for reading. Subtests include Word Identification (reading vocabulary), Word Attack (decoding of nonsense words), Word Comprehension (synonyms, antonyms, analogies), Passage Comprehension (identification of missing words in a sentence or paragraph), and Oral Reading Fluency (efficiency x accuracy). Total Score .488 .692 Table 4. Differences between school day and non-school day testing for CHL. References are available at https://medschool.vanderbilt.edu/developmental-disabilities-lab/
