AP BIOLOGY
ECOLOGY
ACTIVITY #3
NAME_____________________
DATE____________HOUR____
POPULATION ECOLOGY
POPULATION
Group of individuals:
• of the same species
• living in the same area
• using the same resources
• responding to the same stimuli
POPULATION CHARACTERISTICS
Density:
• Number of individuals per
unit area or volume
Patterns of dispersion
• Spacing between
individuals
• Categories
o Clumped
o Uniform
o Random
Demography
• Study of vital statistics of
a population
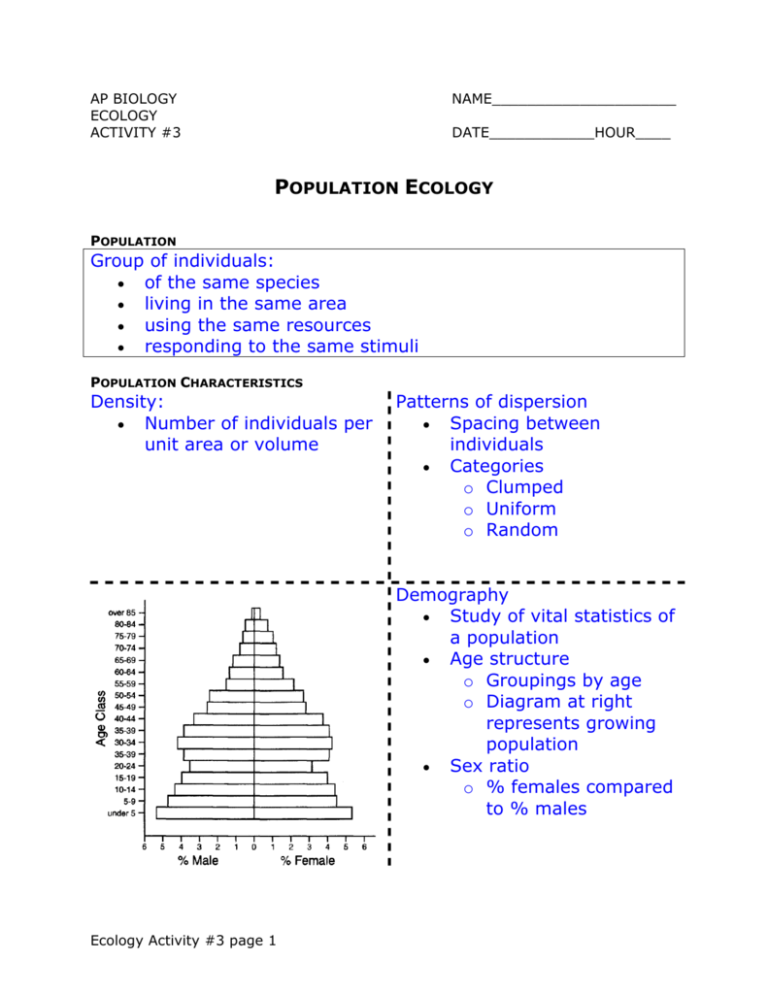
• Age structure
o Groupings by age
o Diagram at right
represents growing
population
• Sex ratio
o % females compared
to % males
Ecology Activity #3 page 1
Survivorship curves
• Graph of number of survivors
vs. relative age
• Type I
o Most survive to middle age
o Ex. humans
• Type II
o Likelihood of death same at
any age
o Ex. hydra
• Type III
o Most individuals die young
o Ex. fish
POPULATION GROWTH MODELS
Exponential growth
∆N
= rN
∆t
•
•
Change in # of individuals
(∆N) over time (∆t) is
equal to the growth rate
(r) times the number of
individuals (N)
J-shaped curve
Logistic growth
∆N
⎛K − N⎞
= rN⎜
⎟
∆t
K
⎝
⎠
•
•
•
Ecology Activity #3 page 2
When limiting factors
restrict size of population
to carrying capacity
Carrying capacity (K) =
max. # of individuals of a
population that can be
sustained by the habitat
Sigmoid (S) shaped curve

