Poster1_Arrhythmia_Recognition_e
advertisement
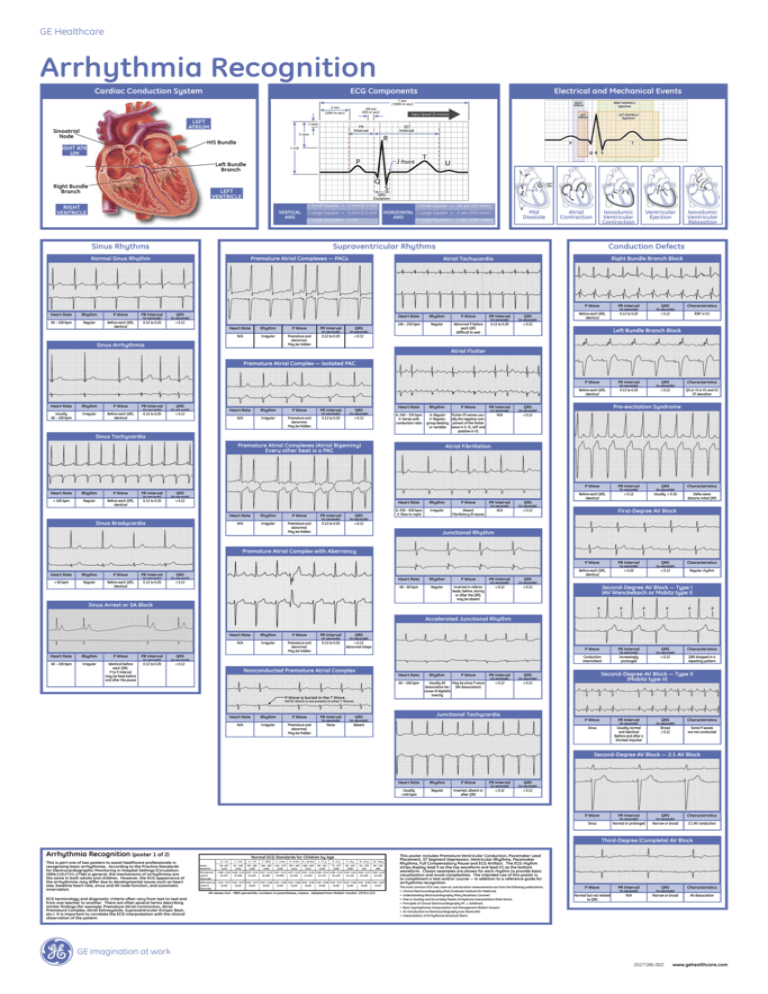
GE Healthcare Arrhythmia Recognition Cardiac Conduction System ECG Components Electrical and Mechanical Events LEFT ATRIUM Sinoatrial Node HIS Bundle RIGHT ATRIUM Left Bundle Branch Right Bundle Branch LEFT VENTRICLE RIGHT VENTRICLE VERTICAL AXIS 1 Small Square = 1 mm (0.1 mV) 1 Small Square = .04 sec (40 msec) 1 Large Square = 5 mm (0.5 mV) HORIZONTAL 1 Large Square = .2 sec (200 msec) AXIS 2 Large Squares = 1 mV Sinus Rhythms Mid Diastole 5 Large Squares = 1 sec (1000 msec) Atrial Contraction Isovolumic Ventricular Contraction Supraventricular Rhythms Normal Sinus Rhythm Right Bundle Branch Block Atrial Tachycardia Heart Rate Rhythm P Wave PR Interval (in seconds) (in seconds) QRS Heart Rate Rhythm P Wave PR Interval 60 – 100 bpm Regular Before each QRS, identical 0.12 to 0.20 < 0.12 (in seconds) (in seconds) 140 – 250 bpm Regular Abnormal P before each QRS (difficult to see) 0.12 to 0.20 < 0.12 Rhythm P Wave PR Interval (in seconds) (in seconds) N/A Irregular Premature and abnormal. May be hidden 0.12 to 0.20 < 0.12 Sinus Arrhythmia QRS Isovolumic Ventricular Relaxation Conduction Defects Premature Atrial Complexes — PACs Heart Rate Ventricular Ejection QRS P Wave PR Interval (in seconds) (in seconds) QRS Characteristics Before each QRS, identical 0.12 to 0.20 ≥ 0.12 RSR’ in V1 Left Bundle Branch Block Atrial Flutter Premature Atrial Complex — Isolated PAC Heart Rate Usually 60 – 100 bpm Rhythm Irregular P Wave Before each QRS, identical PR Interval (in seconds) 0.12 to 0.20 QRS (in seconds) < 0.12 Heart Rate Rhythm P Wave PR Interval QRS (in seconds) (in seconds) N/A Irregular Premature and abnormal. May be hidden 0.12 to 0.20 < 0.12 Heart Rate Rhythm P Wave PR Interval (in seconds) (in seconds) A: 240 – 350 bpm V: Varies with conduction ratio A: Regular V: Regular, group beating or variable Flutter (F) waves usually the negative component of the flutter wave in II, III, aVF and positive in V1 N/A < 0.12 Sinus Tachycardia Premature Atrial Complexes (Atrial Bigeminy) Every other beat is a PAC Heart Rate Rhythm P Wave PR Interval > 100 bpm Regular Before each QRS, identical 0.12 to 0.20 (in seconds) < 0.12 Sinus Bradycardia P Wave PR Interval (in seconds) (in seconds) N/A Irregular Premature and abnormal. May be hidden 0.12 to 0.20 < 0.12 (in seconds) (in seconds) QRS Characteristics Before each QRS, identical 0.12 to 0.20 ≥ 0.12 QS or rS in V1 and V2 ST elevation Pre-excitation Syndrome Atrial Fibrillation QRS Rhythm PR Interval QRS (in seconds) Heart Rate P Wave QRS Heart Rate Rhythm P Wave PR Interval (in seconds) (in seconds) QRS A: 350 – 650 bpm V: Slow to rapid Irregular Absent Fibrillatory (f) waves N/A < 0.12 P Wave PR Interval (in seconds) (in seconds) QRS Characteristics Before each QRS, identical < 0.12 Usually > 0.10 Delta wave distorts initial QRS First-Degree AV Block Junctional Rhythm Premature Atrial Complex with Aberrancy Heart Rate Rhythm P Wave PR Interval < 60 bpm Regular Before each QRS, identical 0.12 to 0.20 (in seconds) QRS (in seconds) < 0.12 Heart Rate Rhythm P Wave PR Interval (in seconds) (in seconds) QRS 40 – 60 bpm Regular Inverted in inferior leads; before, during or after the QRS; may be absent < 0.12 < 0.12 P Wave PR Interval (in seconds) (in seconds) QRS Characteristics Before each QRS, identical > 0.20 < 0.12 Regular rhythm Second-Degree AV Block — Type I (AV Wenckebach or Mobitz type I) Sinus Arrest or SA Block P P P P P P Accelerated Junctional Rhythm Heart Rate Rhythm P Wave PR Interval 40 – 100 bpm Irregular Identical before each QRS. P to P interval may be fixed before and after the pause 0.12 to 0.20 (in seconds) Heart Rate Rhythm P Wave PR Interval (in seconds) (in seconds) QRS N/A Irregular Premature and abnormal. May be hidden 0.12 to 0.20 < 0.12 Abnormal shape QRS (in seconds) < 0.12 Nonconducted Premature Atrial Complex Heart Rate 60 – 100 bpm P Wave is buried in the T Wave. Rhythm P Wave Usually AV May be sinus P wave dissociation be- (AV dissociation) cause of digitalis toxicity PR Interval P Wave PR Interval (in seconds) (in seconds) QRS Characteristics Conduction intermittent Increasingly prolonged < 0.12 QRS dropped in a repeating pattern Second-Degree AV Block — Type II (Mobitz type II) QRS (in seconds) (in seconds) < 0.12 < 0.12 NOTE: Notch is not present in other T Waves Heart Rate Rhythm P Wave PR Interval (in seconds) (in seconds) N/A Irregular Premature and abnormal. May be hidden None Absent Junctional Tachycardia QRS P Wave PR Interval (in seconds) (in seconds) QRS Characteristics Sinus Usually normal and identical (before and after a blocked impulse) Broad ≥ 0.12 Some P waves are not conducted Second-Degree AV Block — 2:1 AV Block Heart Rate Rhythm P Wave PR Interval (in seconds) (in seconds) QRS Usually <140 bpm Regular Inverted, absent or after QRS < 0.12 < 0.12 P Wave PR Interval (in seconds) (in seconds) QRS Characteristics Sinus Normal or prolonged Narrow or broad 2:1 AV conduction Third-Degree (Complete) AV Block Arrhythmia Recognition (poster 1 of 2) This is part one of two posters to assist healthcare professionals in recognizing basic arrhythmias. According to the Practice Standards for Electrocardiographic Monitoring in Hospital Settings (Circulation. 2004;110:2721-2746) in general, the mechanisms of arrhythmias are the same in both adults and children. However, the ECG appearance of the arrhythmias may differ due to developmental issues such as heart size, baseline heart rate, sinus and AV node function, and automatic innervation. ECG terminology and diagnostic criteria often vary from text to text and from one teacher to another. There are often several terms describing similar findings (for example: Premature Atrial Contraction, Atrial Premature Complex, Atrial Extrasystole, Supraventricular Ectopic Beat, etc.) It is important to correlate the ECG interpretation with the clinical observation of the patient. Normal ECG Standards for Children by Age Heart Rate/Min 0–1d 1–3d 3–7d 7 – 30 d 1 – 3 mo 3 – 6 mo 6 – 12 mo 1–3 y 3–5y 5–8y 8 – 12 y 12 – 16 y 94 -155 (122) 91 - 158 (122) 90 - 166 (128) 106 - 182 (149) 120 - 179 (149) 105 - 185 (141) 108 - 169 (131) 89 - 152 (119) 73 - 137 (109) 65 - 133 (100) 62 - 130 (91) 60 - 120 (80) PR Interval Lead II (Seconds) 0.08 - 0.16 0.08 - 0.14 0.07 - 0.15 0.07 - 0.14 0.07 - 0.13 0.07 - 0.15 0.07 - 0.16 0.08 - 0.15 0.08 - 0.16 0.09 - 0.16 0.09 - 0.17 0.09 - 0.18 (0.107) (0.108) (0.102) (0.100) (0.098) (0.105) (0.106) (0.113) (0.119) (0.123) (0.128) (0.135) QRS Interval Lead V5 (Seconds) 0.02 - 0.07 0.02 - 0.07 0.02 - 0.07 0.02 - 0.08 0.02 - 0.08 0.02 - 0.08 0.03 - 0.08 0.03 - 0.08 0.03 - 0.07 0.03 - 0.08 0.04 - 0.09 0.04 - 0.09 (0.05) (0.05) (0.05) (0.05) (0.05) (0.05) (0.05) (0.06) (0.06) (0.06) (0.06) (0.07) All values 2nd – 98th percentile; numbers in parentheses, means. Adapted from Pediatr Cardiol. 1979;1:123. This poster includes Premature Ventricular Conduction, Pacemaker Lead Placement, ST Segment Depression, Ventricular Rhythms, Pacemaker Rhythms, Full Compensatory Pause and ECG Artifact. The ECG rhythm strips display lead II as the top waveform and lead V1 as the bottom waveform. Classic examples are shown for each rhythm to provide basic visualization and avoid complexities. The intended use of this poster is to compliment a text and/or course — in addition to a reference guide for arrhythmia recognition The most common ECG rate, interval, and duration measurements are from the following publications: • Clinical Electrocardiography (Post Graduate Institute for Medicine). • Understanding Electrocardiography (Mary Boudreau Conover). • How to Quickly and Accurately Master Arrhythmia Interpretation (Dale Davis). • Principles of Clinical Electrocardiography (M. J. Goldman). • Basic Dysrhythmias Interpretation and Management (Robert Huszar). • An Introduction to Electrocardiography (Leo Shamroth). • Interpretation of Arrhythmias (Emanual Stein). P Wave PR Interval (in seconds) (in seconds) QRS Characteristics Normal but not related to QRS N/A Narrow or broad AV dissociation GE imagination at work 2027186-002 www.gehealthcare.com

