Cardiovascular 7 – Basic Disturbances in Rhythm
advertisement
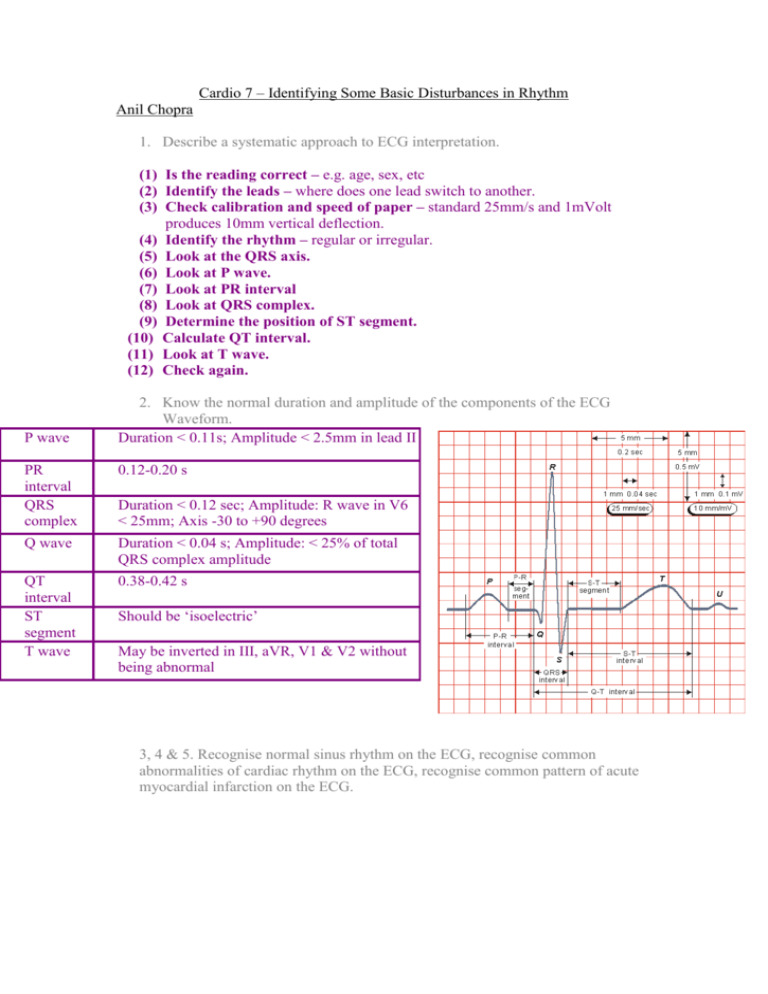
Cardio 7 – Identifying Some Basic Disturbances in Rhythm Anil Chopra 1. Describe a systematic approach to ECG interpretation. (1) Is the reading correct – e.g. age, sex, etc (2) Identify the leads – where does one lead switch to another. (3) Check calibration and speed of paper – standard 25mm/s and 1mVolt produces 10mm vertical deflection. (4) Identify the rhythm – regular or irregular. (5) Look at the QRS axis. (6) Look at P wave. (7) Look at PR interval (8) Look at QRS complex. (9) Determine the position of ST segment. (10) Calculate QT interval. (11) Look at T wave. (12) Check again. P wave 2. Know the normal duration and amplitude of the components of the ECG Waveform. Duration < 0.11s; Amplitude < 2.5mm in lead II PR interval QRS complex 0.12-0.20 s Q wave Duration < 0.04 s; Amplitude: < 25% of total QRS complex amplitude QT interval ST segment T wave 0.38-0.42 s Duration < 0.12 sec; Amplitude: R wave in V6 < 25mm; Axis -30 to +90 degrees Should be ‘isoelectric’ May be inverted in III, aVR, V1 & V2 without being abnormal 3, 4 & 5. Recognise normal sinus rhythm on the ECG, recognise common abnormalities of cardiac rhythm on the ECG, recognise common pattern of acute myocardial infarction on the ECG. (1) Is the reading correct - Check that the name, age, gender and date are correct. (2) Identify the leads. - Check that the leads are in the standard format on the sheet with the rhythm strip at the bottom. (3) Check calibration and speed of paper. - The standard is 25mm/s and 1mVolt produces 10mm vertical deflection. - May wish to study parts in more detail so print out changed. (4) Identify the rhythm. - Divide 300 by number of large squares between QRS complexes to get the heart rate. - Normal heart rate is 75 bpm. - If it is below 60bpm it is bradycardia. - If it is above 100bpm, it is tachycardia. - Check if the rhythm is a sinus rhythm i.e. the P wave followed by QRS wave every time. - Rhythm may be irregular due to: Ectopic beat - Irregular or extra QRS complex Sinus Arrhythmia - Slight increase in heart rate in inspiration Atrial Fibrillation - No P wave! - Fast atrial rate - Irregular ventricular rate - Fast ventricular rate. Atrial Flutter - Saw-toothed baseline. - Fast atrial rate (250-350) - Regular fast ventricular rhythm Ventricular Fibrillation Ventricular Tachycardia Pre-excitation Syndrome - Bundle of His is bypassed so ventricular diastole occurs early. (5) Look at the QRS axis. - QRS axis determined by orientation in the chest and the thickness of the ventricular walls. Also known as the MFPA. - Usually between -30° or +90° – tends to be more vertical in thinner patients and more horizontal in fat patients. - Cane have right axis deviation ( in right ventricular hypertrophy) and left axis deviation ( in left ventricular hypertrophy) - Can also be indicative of diseases of the conducting tissue. (6) Look at P wave. - Look for duration (<0.11s) and amplitude (<2.5mm) - If they are greater than normal atrial hypertrophy - Higher amplitude suggests right atrial hypertrophy (possibly due to pulmonary hypertension) - Long P-waves suggest left atrial hypertrophy especially if there are 2 peaks. (Possibly caused by mitral stenosis) (7) Look at PR interval - Should be between 0.12 and 0.20 seconds. - If it is SHORT then it is indicative of Wolf – Parkinson – White syndrome. This is because something is causing the nerve impulse to bypass the delay of the AV node. Secondary degree heart block First degree heart Type I – PR interval gets longer block – longer PR until one is not followed by a interval due to QRS complex and then the cycle delayed conduction starts again. through the AV Secondary degree node. heart block Type II – PR interval is Complete heart block constant but – no relation occasionally misses between P and QRS out a QRS complex. waves. The atria and ventricles are contracting independently. (8) Look at QRS complex. - Amplitude should be around 25mm in V6 - High amplitude indicative of ventricular hypertrophy. - Low amplitude indicative of obesity, COPD, pericardial effusion, hyper-inflated lung, hypothyroidism. - Length should be nor more than 120 milliseconds. - Longer time indicative of bundle branch block. The different branches of the bundle of His become blocked. This is because if a bundle branch is blocked, it will take longer time for the electrical signal to pass through. Right Bundle Branch Block Has “rabbit ears” in V1 lead, and odd V2 shape as they overlie right ventricle. Left Bundle Branch Block Wide QRS complexes. (9) Determine the position of ST segment. - ST should be on the isoelectric line. - If below the isoelectric line, then it is “ST depression”. This can be due to drugs, myocardial ischaemia or ventricular hypertrophy. (exercise is used to test for if it is myocardial ischaemia or ventricular hypertrophy by testing pain when exerted on a treadmill). - Elevated ST segments may be indicative of acute myocardial infarction or aneurysm. - Myocardial infarction. Starts if with abnormal elevation of ST segment. Then T wave inversion. Development of Q-waves. (10) Calculate QT interval. - Normally between 0.38 and 0.42 seconds. - Will be shorter with increasing heart rate. - Can be prolonged with drugs, hypocalcaemia and congenital heart diseases (which result in sudden death). (11) Look at T wave. - Check its amplitude and whether it is upright or inverted. Duration should also be checked. - Inversion can be a sign of previous infection or can indicate damage to underlying heart muscle (monocarditis or hypertrophy).


