AP Microeconomics – Chapter 1 Outline I. Learning Objectives – In
advertisement
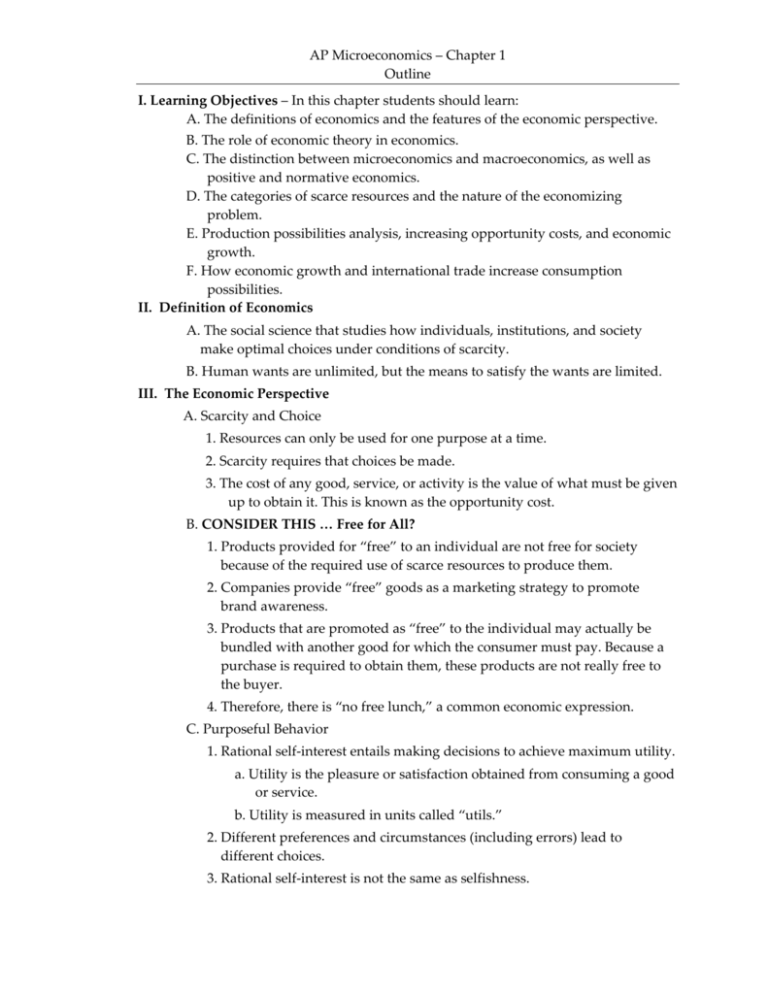
AP Microeconomics – Chapter 1 Outline I. Learning Objectives – In this chapter students should learn: A. The definitions of economics and the features of the economic perspective. B. The role of economic theory in economics. C. The distinction between microeconomics and macroeconomics, as well as positive and normative economics. D. The categories of scarce resources and the nature of the economizing problem. E. Production possibilities analysis, increasing opportunity costs, and economic growth. F. How economic growth and international trade increase consumption possibilities. II. Definition of Economics A. The social science that studies how individuals, institutions, and society make optimal choices under conditions of scarcity. B. Human wants are unlimited, but the means to satisfy the wants are limited. III. The Economic Perspective A. Scarcity and Choice 1. Resources can only be used for one purpose at a time. 2. Scarcity requires that choices be made. 3. The cost of any good, service, or activity is the value of what must be given up to obtain it. This is known as the opportunity cost. B. CONSIDER THIS … Free for All? 1. Products provided for “free” to an individual are not free for society because of the required use of scarce resources to produce them. 2. Companies provide “free” goods as a marketing strategy to promote brand awareness. 3. Products that are promoted as “free” to the individual may actually be bundled with another good for which the consumer must pay. Because a purchase is required to obtain them, these products are not really free to the buyer. 4. Therefore, there is “no free lunch,” a common economic expression. C. Purposeful Behavior 1. Rational self‐interest entails making decisions to achieve maximum utility. a. Utility is the pleasure or satisfaction obtained from consuming a good or service. b. Utility is measured in units called “utils.” 2. Different preferences and circumstances (including errors) lead to different choices. 3. Rational self‐interest is not the same as selfishness. AP Microeconomics – Chapter 1 Outline D. Marginal Analysis: Benefits and Costs 1. Most decisions concern a change in current conditions; therefore the economic perspective is largely focused on marginal analysis. 2. Each option considered weighs the marginal benefit against the marginal cost. 3. Whether the decision is personal or one made by business or government, the principle is the same. 4. The marginal cost of an action should not exceed its marginal benefit. 5. Opportunity cost is the value of the next best thing forgone. 6. Opportunity costs are always present whenever a decision is made. E. CONSIDER THIS … Fast Food Lines—An Economic Perspective 1. People choose the shortest line to reduce time cost. 2. Lines tend to have equal lengths as people shift from longer to shorter lines in an effort to save time. 3. Lines are chosen based on length without much other information—cost of obtaining more information is not worth the benefit. a. Imperfect information may lead to an unexpected wait. b. Imperfect information may cause some people to leave when they see a long line. 4. When a customer reaches the counter, other economic decisions are made about what to order. From an economic perspective, these choices will be made after the consumer compares the costs and benefits of possible choices. IV. Theories, Principles, and Models A. Economists use the scientific method to establish theories, laws, and principles. 1. The scientific method consists of: a. The observation of facts (real data). b. The formulation of explanations of cause and effect relationships (hypotheses) based upon the facts. c. The testing of the hypotheses. d. The acceptance, rejection, or modification of the hypotheses. e. The continued testing with an eye toward determination of a theory, law, principle, or model. 2. Theories, principles, and models are “purposeful simplifications.” 3. Principles are used to explain and/or predict the behavior of individuals and institutions. AP Microeconomics – Chapter 1 Outline 4. Terminology—Principles, laws, theories, and models are all terms that refer to generalizations about economic behavior. They are used synonymously in the text, with custom or convenience governing the choice in each particular case. B. Generalizations—Economic principles are expressed as the tendencies of the typical or average consumer, worker, or business firm. C. “Other things equal” or ceteris paribus assumption—In order to judge the effect one variable has upon another, it is necessary to hold other contributing factors constant. Natural scientists can test with much greater precision than can economists. They have the advantage of controlled laboratory experiments. Economists must test their theories using the real world as their laboratory. D. Graphical Expression—Many economic relationships are quantitative and are demonstrated efficiently with graphs. The “key graphs” are the most important. V. Microeconomics and Macroeconomics A. Microeconomics looks at specific economic units—the small picture. 1. It is concerned with the individual industry, firm or household and the prices of specific products and resources. 2. It is an examination of sand, rocks, and shells, not the whole beach. B. Macroeconomics examines the economy as a whole—the big picture. 1. It includes measures of total output, total employment, total income, aggregate expenditures, and the general price level. 2. It is a general overview examining the beach, not the sand, rocks, and shells. C. Positive and Normative Economics 1. Positive economics describes the economy as it actually is, avoiding value judgments and attempting to establish scientific statements about economic behavior. 2. Normative economics involves value judgments about what the economy should be like and the desirability of the policy options available. 3. Most disagreements among economists involve normative, value‐based questions. VI. Individual’s Economizing Problem A. Individuals are confronted with the need to make choices because their wants exceed their means to satisfy them. B. Limited income—everyone, even the most wealthy, has a finite amount of money to spend. C. Unlimited wants—people’s wants are virtually unlimited. AP Microeconomics – Chapter 1 Outline 1. Wants include both necessities and luxuries (although many economists don’t worry about this distinction). 2. Wants change, especially as new products are introduced. 3. Both goods and services satisfy wants. 4. Even the wealthiest have wants that extend beyond their means (e.g. Bill Gates’ charitable efforts). D. The combination of limited income and unlimited wants forces us to choose those goods and services that will maximize our utility. E. Consider This … Did Gates, Winfrey, and Rodriguez Make Bad Choices? 1. The college decision requires weighing future benefits, including projected lifetime earnings, against present costs, including direct costs (tuition) and indirect costs (forgone wages). 2. Despite the success of celebrities such as Bill Gates, Oprah Winfrey, and Alex Rodriguez, in general those attending and completing college will earn greater lifetime earnings (about 50% more) than those holding only high school diplomas. 3. For Gates, Winfrey, Rodriguez, and others like them, the opportunity cost of college was extremely high, and it would be hard to argue that they made a wrong decision. VII. Society’s Economizing Problem A. Scarce Resources 1. Economic resources are limited relative to wants. 2. Economic resources are sometimes called factors of production and include all natural, human, and manufactured resources used to produce goods and services. B. Resource Categories 1. Land or natural resources (“gifts of nature”). 2. Labor or human resources, which include physical and mental abilities used in production. 3. Capital or investment goods, which are all manufactured aids to production like tools, equipment, factories, and transportation. 4. Entrepreneurial ability, a special kind of human resource that provides four important functions: a. Combines resources needed for production. b. Makes basic business policy decisions. c. Innovates new products, production techniques, and organizational forms. d. Bears the risk of time, effort, and funds. AP Microeconomics – Chapter 1 Outline VIII. Production possibilities tables and curves are devices used to illustrate and clarify society’s economizing problem. A. Assumptions 1. Economy is employing all available resources (full employment). 2. Available supply of resources is fixed in quantity and quality at this point in time. 3. Technology is constant during analysis. 4. Economy produces only two types of products. a. While any two goods or services could be used, the example in the chapter assumes that one product is a consumer good (pizza), the other a capital good (industrial robots). b. Consumer goods directly satisfy wants; capital goods, which are used to produce consumer goods, indirectly satisfy wants. B. Choices will be necessary because resources and technology are fixed. If we produce more of one good, we must produce less of another. A production possibilities table illustrates some of the possible choices (see Table 1.1). C. A production possibilities curve is a graphical representation of choices. 1. Points on the curve represent maximum possible combinations of goods and services, given resources and technology. 2. Points inside the curve represent underemployment or unemployment. 3. Points outside the curve are unattainable at present. D. Optimal or Best Product‐mix 1. It will be some point on the curve. 2. The exact point depends on society; this is a normative decision. E. Law of Increasing Opportunity Costs 1. The amount of other products that must be foregone to obtain more of any given product is called the opportunity cost. 2. Opportunity costs are measured in real terms rather than money (market prices are not part of the production possibilities model). 3. The more of a product produced, the greater is its (marginal) opportunity cost. AP Microeconomics – Chapter 1 Outline 4. The slope of the production possibilities curve becomes steeper, demonstrating increasing opportunity cost. This makes the curve appear bowed out, concave from the origin. 5. Economic Rationale a. Economic resources are not completely adaptable to alternative uses. b. To get increasing amounts of pizza, resources not particularly well suited for the purpose of making pizza must be used. For example, workers that are accustomed to producing robots on an assembly line may not do well as kitchen help. F. Optimal Allocation Revisited 1. How does society decide its optimal point on the production possibilities curve? 2. Recall that society receives marginal benefits from each additional product consumed, and as long as this marginal benefit is more than the additional cost of the product, it is advantageous to have the additional product. 3. Conversely, if the additional (marginal) cost of obtaining an additional product is more than the additional benefit received, then it is not “worth” it to society to produce the extra unit. 4. Figure 1.3 reminds us that marginal costs rise as more of a product is produced. 5. Marginal benefits decline as society consumes more and more pizzas. In Figure 1.3 we can see that the optimal amount of pizza is 200,000 units, where marginal benefit just covers marginal cost. a. Beyond 200,000 pizzas, the added benefits would be less than the added cost. b. At less than 200,000, the added benefits will exceed the added costs, so it makes sense to produce more. AP Microeconomics – Chapter 1 Outline 6. Generalization: The optimal production of any item is where its marginal benefit is equal to its marginal cost. In our example, this must occur at 7,000 robots. G. Consider This … The Economics of War 1. The costs of the war on terrorism at the end of 2010 were estimated to be more than $1.05 trillion. 2. The war on terrorism can be represented by a movement along the production possibilities curve, as resources are reallocated from “civilian goods” to “defense goods.” The decision of how much to reallocate should be made by weighing the marginal benefits against the marginal costs of more defense goods. 3. Marginal benefit—marginal cost analysis is needed to find the optimal mix of defense and civilian goods. The September 11, 2001, terrorist attacks caused a perceived increase the MB curve for defense goods, and shifts in resources toward defense goods since the attacks reflect that perception. As the model reveals, however, it is possible to go too far, sacrificing too many civilian goods to obtain defense goods. IX. Unemployment, Growth, and the Future A. Unemployment occurs when the economy is producing at less than full employment or inside the curve (point U in Figure 1.4). B. A growing economy results in larger total output and is illustrated by an outward shift of the production possibilities curve. C. There are three main causes of economic growth. 1. Increases in the quantity of resources supplied. 2. Increases or improvements in the quality of resources supplied. 3. Advances in technology employed in the production or distribution process. AP Microeconomics – Chapter 1 Outline D. Present Choices and Future Possibilities 1. Using resources to produce consumer goods and services represents a choice for present over future consumption. 2. Using resources to invest in technological advance, education, and capital goods represents a choice for future over present goods. 3. The decision as to how to allocate resources in the present will create more or less economic growth in the future. E. A Qualification: International Trade 1. A nation can avoid the output limits of its domestic production possibilities through international specialization and trade. 2. Nations specialize in producing the goods for which they have the lowest opportunity costs and sell them to other countries; they then buy other goods from countries that produce at a lower opportunity cost. As a result, a nation can buy imports for a lower opportunity cost than they can produce them domestically. 3. Specialization and trade have the same effect as having more and better resources or improved technology. X. LAST WORD: Pitfalls to Sound Reasoning A. Biases—Preconceptions that are not based on facts. B. Loaded Terminology 1. Terms that contain the prejudice and value judgments of others. 2. It is very difficult for a person to describe economic behavior without letting their options about that behavior creep into their discussion. The distinction between positive and normative statements is not always clearly apparent. 3. Often, however, there is a deliberate attempt to sway opinion by using loaded terminology (greedy owners, obscene profits, exploited workers, mindless bureaucrats, costly regulations, creeping socialism). C. Fallacy of Composition 1. Fallacy—what is true for one individual or part of a whole is necessarily true for a group of individuals or the whole. 2. Examples: An individual stockholder’s sales of shares v. a large number of stockholders selling large numbers of shares; revenues of an individual cattle rancher expanding a herd v. falling prices due to the actions of a large group of cattle ranchers. D. Causation Fallacies 1. Post hoc fallacy—when two events occur in time sequence, the first event is not necessarily the cause of the second event. AP Microeconomics – Chapter 1 Outline 2. Correlation versus causation—events may be related without a causal relationship. a. The positive relationship between education and income does not tell us which causes the increase in the other. (Which is the independent variable and which is the dependent variable?) b. It may be that the increase in income that occurs with increased education is due to some other third factor that is not under direct consideration.
