Freezing Point
advertisement
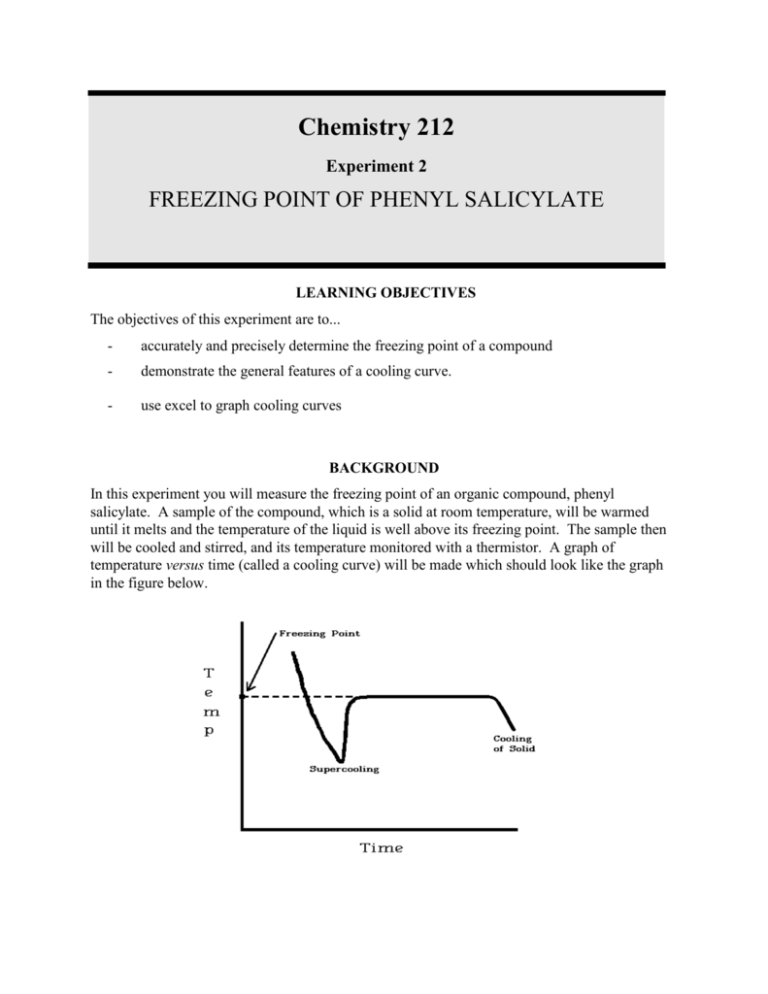
Chemistry 212 Experiment 2 FREEZING POINT OF PHENYL SALICYLATE LEARNING OBJECTIVES The objectives of this experiment are to... - accurately and precisely determine the freezing point of a compound - demonstrate the general features of a cooling curve. - use excel to graph cooling curves BACKGROUND In this experiment you will measure the freezing point of an organic compound, phenyl salicylate. A sample of the compound, which is a solid at room temperature, will be warmed until it melts and the temperature of the liquid is well above its freezing point. The sample then will be cooled and stirred, and its temperature monitored with a thermistor. A graph of temperature versus time (called a cooling curve) will be made which should look like the graph in the figure below. Note that the graph shows the temperature first dropping as the liquid is cooled, then remaining constant when both liquid and solid phases are present. It finally drops again when only solid phase is present. The freezing point is the constant temperature of the solid-liquid mixture. It is not uncommon for liquids to exhibit supercooling as shown in the figure. Temperature measurement in the experiment is made with a thermistor. Thermistors are temperature sensitive resistors, made of a semi-conducting ceramic material. SAFETY PRECAUTIONS Phenyl salicylate is used topically as an analgesic and antipyretic but is also listed as an irritant. Any contacted skin should be washed with soap and water. Safety goggles must be worn at all times in the lab. EXPERIMENTAL PROCEDURE Setting Up the Apparatus The general idea for the apparatus for this experiment is shown in the figure above. (Your instructor will demonstrate exactly how to set up the apparatus.) Assemble the apparatus as indicated but do not insert the test tube with the phenyl salicylate, thermistor, and metal stirrer into the nesting tube. The inner beaker contains an ice-water slurry. The beaker size is approximately 400 mL to 600 mL. When the apparatus is assembled, place the test tube containing the phenyl salicylate into the 250 mL beaker of 55oC water. When the solid begins to melt, use the stirrer to gently agitate the mixture. When the entire solid is melted, continue warming and stirring the liquid for a few minutes. Toward the end of this warming period, begin the preparations described in the following section. Running the Experiment Record the temperature of the phenyl salicylate displayed on the monitor (the test tube should still be in the hot water beaker). If the readings are below 50oC, continue heating and stirring until the readings are above 50oC. Then quickly transfer the sample tube into the nesting test tube. Continue stirring constantly and recording temperature and time data as the cooling curve data is collected and go until solid forms and stirring is no longer possible. At that point continue taking data until the sample completely solidifies and the temperature of the solid continues to drops below the freezing point. Repeat experiment by removing the sample tube carefully from the ice bath and placing it in the hot water bath at 55oC to melt the solid. Repeat the experiment a total of 5 times. When finished with all trials carefully remove and wipe off the thermistor and stirrer (use acetone to clean). Dispose of remaining phenyl salicylate in the provided waste container. DATA ANALYSIS Put all cooling curve data on one graph (Attach this graph to your report). Do not print the spreadsheet. Determine freezing points from graph and/or spreadsheet. FREEZING POINT OF PHENYL SALICYLATE Data Sheet Result Tables Observed Freezing Points Trial 1 Literature value for the melting point of Phenyl Salicylate as found in _______________ Trial 2 Trial 3 _____________oC Trial 4 Trial 5 Percent Error for Experiment Average ______________% Chemistry 212 Pre-Laboratory Questions FREEZING POINT OF PHENYL SALICYLATE 1. Look up the melting point of phenyl salicylate. a. Melting point - ________ Source - _______________________ b. How is this related to the freezing point? 2. A student performed an experiment to determine the freezing point of a substance. The literature value of the freezing point was 60.2 degrees Celsius. Her experimental values are recorded in the table below. Discuss the precision and accuracy of the experiments. Observed Freezing Points (oC) Trial 1 55.3 Trial 2 56.7 Trial 3 54.8 Trial 4 55.6 Trial 5 55.5 Average
