Lab 6- Cooling Curve
advertisement
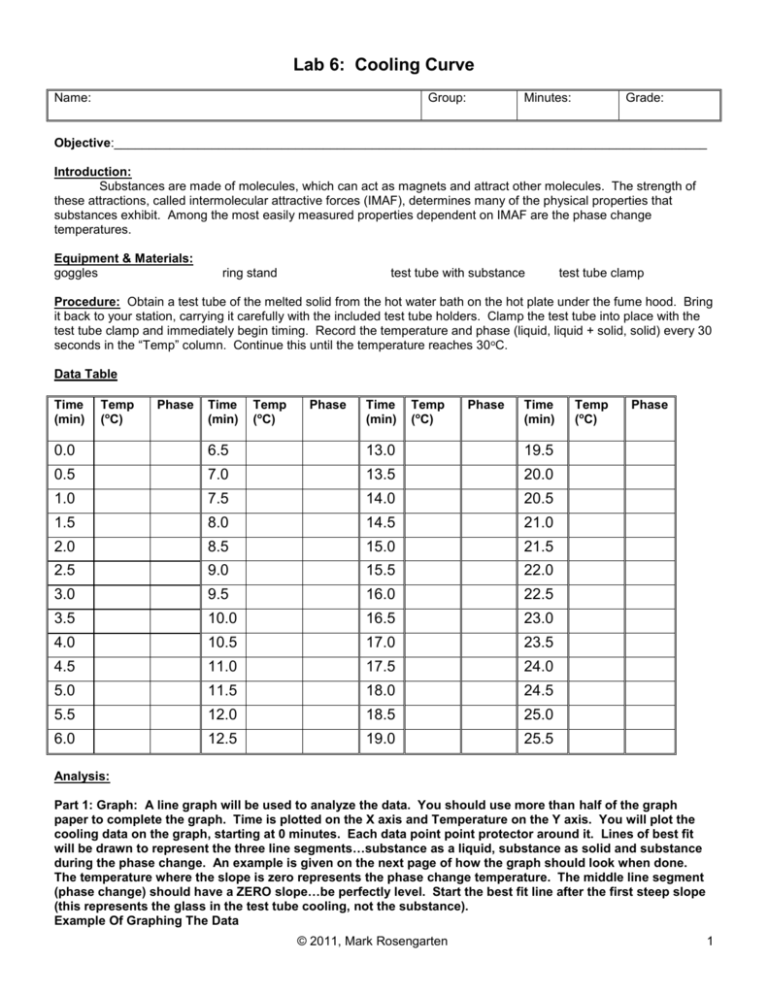
Lab 6: Cooling Curve Name: Group: Minutes: Grade: Objective:_____________________________________________________________________________________ Introduction: Substances are made of molecules, which can act as magnets and attract other molecules. The strength of these attractions, called intermolecular attractive forces (IMAF), determines many of the physical properties that substances exhibit. Among the most easily measured properties dependent on IMAF are the phase change temperatures. Equipment & Materials: goggles ring stand test tube with substance test tube clamp Procedure: Obtain a test tube of the melted solid from the hot water bath on the hot plate under the fume hood. Bring it back to your station, carrying it carefully with the included test tube holders. Clamp the test tube into place with the test tube clamp and immediately begin timing. Record the temperature and phase (liquid, liquid + solid, solid) every 30 seconds in the “Temp” column. Continue this until the temperature reaches 30 oC. Data Table Time (min) Temp (oC) Phase Time (min) Temp (oC) Phase Time (min) Temp (oC) Phase Time (min) 0.0 6.5 13.0 19.5 0.5 7.0 13.5 20.0 1.0 7.5 14.0 20.5 1.5 8.0 14.5 21.0 2.0 8.5 15.0 21.5 2.5 9.0 15.5 22.0 3.0 9.5 16.0 22.5 3.5 10.0 16.5 23.0 4.0 10.5 17.0 23.5 4.5 11.0 17.5 24.0 5.0 11.5 18.0 24.5 5.5 12.0 18.5 25.0 6.0 12.5 19.0 25.5 Temp (oC) Phase Analysis: Part 1: Graph: A line graph will be used to analyze the data. You should use more than half of the graph paper to complete the graph. Time is plotted on the X axis and Temperature on the Y axis. You will plot the cooling data on the graph, starting at 0 minutes. Each data point point protector around it. Lines of best fit will be drawn to represent the three line segments…substance as a liquid, substance as solid and substance during the phase change. An example is given on the next page of how the graph should look when done. The temperature where the slope is zero represents the phase change temperature. The middle line segment (phase change) should have a ZERO slope…be perfectly level. Start the best fit line after the first steep slope (this represents the glass in the test tube cooling, not the substance). Example Of Graphing The Data © 2011, Mark Rosengarten 1 Label the graph with the following (check off as you do it): Check Job 1) Give the graph a title 2) On both axes, label what was plotted and the units 3) SOLID PHASE 4) LIQUID PHASE 5) LIQUID AND SOLID PHASE 6) FREEZING (put the temperature below) What is the freezing point, based on the cooling curve?______________oC Part 2: Identification of the Pure Substance The list below contains substances that have many properties that are similar. Using the average phase change temperature you determined above, identify the substance! Substance Capric Acid Lauric Acid Maleic Anhydride Napthalene Palmitic Acid Paradichlorobenzene Stearic Acid Freezing Point 31 oC 44 oC 56 oC 81 oC 63 oC 53 oC 70oC What is the identity of the pure substance?_________________________________________________ Calculate your percent error, using the temperature on the chart above as the accepted value and your freezing point determined by the graph as the experimental value: © 2011, Mark Rosengarten 2 Questions: Using the introduction for this lab, your notes and your brain, complete all of the following statements. Two lines means two words in the answer. The statements are in chronological order. 1 The mystery pure substance started out as a _________. 2 Since the temperature was decreasing, the __________ energy was also increasing. 3 When there was very little change in the temperature, I knew a _____ ______ was occurring. 4 The mystery pure substance was at its _________ __________. 5 Now, the ________________ energy was decreasing. 6 The temperature began to change again, when the _________ phase was the only phase present. 7 The intermolecular attractive forces were now _________ than they were in the beginning of the experiment. 8 Since every substance has a unique freezing/melting point, I looked on the chart and determined the substance to be___________. 9 The temperature where the phase change occurred is also the ______ ______ of the substance when heat is added to turn the solid into a liquid. Attach the graph that you drew and labeled to this page. © 2011, Mark Rosengarten 3
