Global Asset Allocation
Oct 9, 2009
The J.P. Morgan View
New investment themes
• Portfolio strategy –– The recovery trade is becoming consensus and should
lose its power to drive markets at some point. We thus diversify through 8 new
investment themes for the coming year. In aggregate, they are also long
equities and credit, and short the USD.
• Economics –– The foundations of the recovery are in place, even as risks are
clearly there
• Fixed Income –– Range trading. Focus on carry and spreads.
• Equities –– Financials should benefit most from Q3 reporting season. Be long
outright and versus other sectors.
• Credit –– We stay overweight US HG given the exceptionally strong demand
• FX –– No urgency to exit the dollar short.
• Alternatives –– Stay short WTI. Be long agricultural products, particularly
sugar and cocoa.
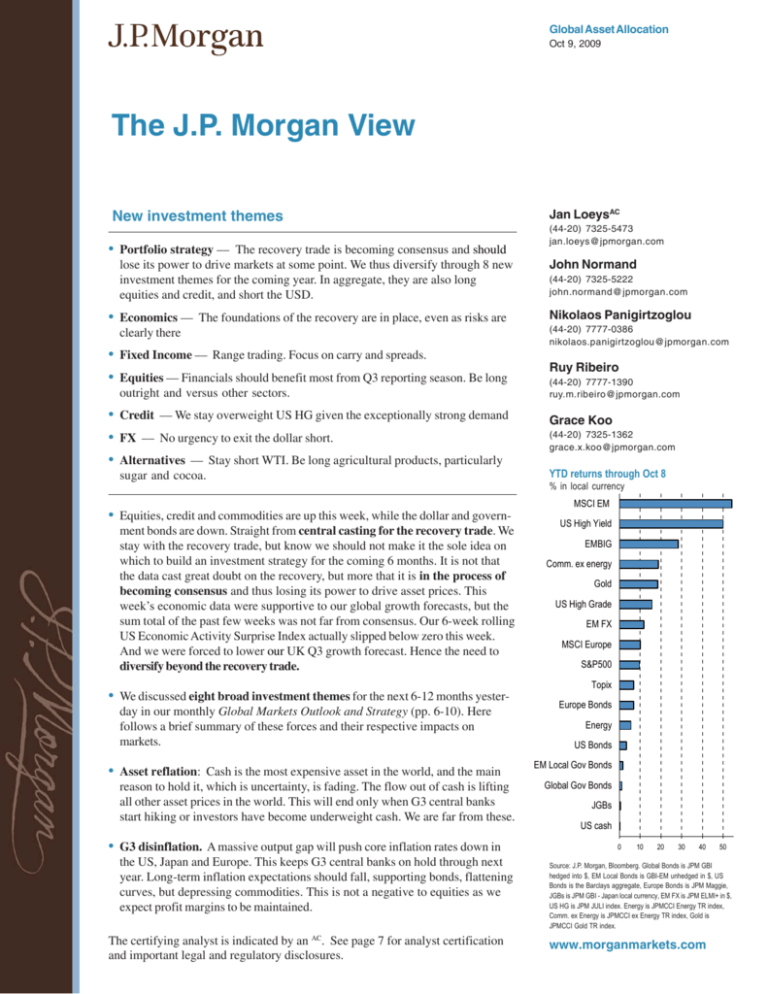
• Equities, credit and commodities are up this week, while the dollar and government bonds are down. Straight from central casting for the recovery trade. We
stay with the recovery trade, but know we should not make it the sole idea on
which to build an investment strategy for the coming 6 months. It is not that
the data cast great doubt on the recovery, but more that it is in the process of
becoming consensus and thus losing its power to drive asset prices. This
week’s economic data were supportive to our global growth forecasts, but the
sum total of the past few weeks was not far from consensus. Our 6-week rolling
US Economic Activity Surprise Index actually slipped below zero this week.
And we were forced to lower our UK Q3 growth forecast. Hence the need to
diversify beyond the recovery trade.
• We discussed eight broad investment themes for the next 6-12 months yesterday in our monthly Global Markets Outlook and Strategy (pp. 6-10). Here
follows a brief summary of these forces and their respective impacts on
markets.
• Asset reflation: Cash is the most expensive asset in the world, and the main
reason to hold it, which is uncertainty, is fading. The flow out of cash is lifting
all other asset prices in the world. This will end only when G3 central banks
start hiking or investors have become underweight cash. We are far from these.
• G3 disinflation. A massive output gap will push core inflation rates down in
the US, Japan and Europe. This keeps G3 central banks on hold through next
year. Long-term inflation expectations should fall, supporting bonds, flattening
curves, but depressing commodities. This is not a negative to equities as we
expect profit margins to be maintained.
The certifying analyst is indicated by an AC. See page 7 for analyst certification
and important legal and regulatory disclosures.
Jan LoeysAC
(44-20) 7325-5473
jan.loeys@jpmorgan.com
John Normand
(44-20) 7325-5222
john.normand@jpmorgan.com
Nikolaos Panigirtzoglou
(44-20) 7777-0386
nikolaos.panigirtzoglou@jpmorgan.com
Ruy Ribeiro
(44-20) 7777-1390
ruy.m.ribeiro@jpmorgan.com
Grace Koo
(44-20) 7325-1362
grace.x.koo@jpmorgan.com
YTD returns through Oct 8
% in local currency
MSCI EM
US High Yield
EMBIG
Comm. ex energy
Gold
US High Grade
EM FX
MSCI Europe
S&P500
Topix
Europe Bonds
Energy
US Bonds
EM Local Gov Bonds
Global Gov Bonds
JGBs
US cash
0
10
20
30
40
50
Source: J.P. Morgan, Bloomberg. Global Bonds is JPM GBI
hedged into $, EM Local Bonds is GBI-EM unhedged in $, US
Bonds is the Barclays aggregate, Europe Bonds is JPM Maggie,
JGBs is JPM GBI - Japan local currency, EM FX is JPM ELMI+ in $,
US HG is JPM JULI index. Energy is JPMCCI Energy TR index,
Comm. ex Energy is JPMCCI ex Energy TR index, Gold is
JPMCCI Gold TR index.
www.morganmarkets.com
Global Asset Allocation
The J.P. Morgan View
• Policy normalization outside the G3. Economies on the global periphery are
closer to full capacity, and are thus likely to normalize monetary policy rates
earlier. Think of Australia, Korea, Czech, Norway, and Brazil. This will benefit
their currencies, but hurt their bond markets. It should be neutral for their
stock markets.
• The new EM trade. Emerging economies are exiting the crisis relatively
unscathed and with an improved economic, financial and fiscal position
versus developed economies. This means medium-term ourperformance of
their equities, currencies and credit. Near term, it makes their local debt likely
to underperform, except for the highest-yielding markets that should benefit
from the search for yield. With much of the EM growth impetus emanating
from commodity-hungry China, this should be bullish commodities.
• Banking revival. Markets are returning rapidly to normal and so are bank
US Economic Activity Surprise Index
30
20
10
0
-10
-20
-30
-40
-50
Jun 07
10%
• Carry and the search for yield. The steady fall in volatility, inflation risks and
6%
• Death of the equity culture? Disappointing long-term equity returns, aging,
and falling wealth are inducing US and European investors to depend less on
equities as the mainstay of their retirement savings. Are they becoming like
Japanese savers? Possibly, but there is one major force standing in the way of
increased reliance on bonds to fund retirements: Yields on global bonds have
fallen below 3%, requiring a massive increase in savings rates in order to meet
pension needs solely with bonds (see chart on right). We believe that ultimately the low value of bonds will trump the fear of equities and entice end
investors back into stocks to fund their pensions.
• Fortress balance sheets and delevering. Repairing balance sheets by improving liquidity, and making greater use of equity and long-dated debt funding
will be with us for years. It implies continued high issuance of equity and
long-dated debt. At this moment, this neatly matches the desire by investors
to move out of low-return cash holdings, thus preventing a significant
steepening of yield curves, or losses on equities. Longer out, it implies that
the risk premium of bonds and equities over cash will stay higher than it has
been over the past decades.
Jun 08
Dec 08
Jun 09
Source: J.P. Morgan. US EASI is defined as the net balance of positive activity surprises
over the past 6 weeks divided by the total number of releases over the period.
profits. Bank losses are not over, but we feel that we are about 3/4rs through
total cycle losses, with the remainder spread over the next five years. The main
threat to bank earnings will eventually come from higher capital requirements.
These will dilute bank earnings, but make bank debt even safer. They suggest
overweighting banks debt, but underweighting bank stocks. The latter is
probably somewhat premature as governments will take at least a year to
decide how much these ratios should go up and will not impose them before
2011.
yield levels are forcing institutional investors –– in particular insurers and
banks –– to move out along the risk return trade off line in search of higher
yields. Many insurers are in dire need of fixed income products with higher
yields as they have a lot of liabilities that promise minimum payouts. This
search for yield and carry is bullish for bonds and credit, and flattens yield
curves in our view. It would be a negative for the USD against better-yielding
currencies, which are largely in EM.
Dec 07
Yield on global bond index
9%
8%
7%
5%
4%
3%
2%
90
92
94
96
98
00
02
04
06
08
Source: J.P. Morgan, BarCap, Datastream. The reported yield is the yield of
the BarCap Global Aggregate index.
More details in ...
Global Data Watch, Bruce Kasman and David Hensley
Global Markets Outlook and Strategy, Jan Loeys, Bruce
Kasman, et al.
US Fixed Income Markets, Terry Belton and Srini
Ramaswamy
Global Fixed Income Markets, Pavan Wadhwa and Fabio
Bassi
Emerging Markets Outlook and Strategy, Joyce Chang
Key trades and risk: Emerging Market Equity Strategy,
Adrian Mowat et al.
Flows and Liquidity, Nikos Panigirtzoglou and Grace Koo
Oct 9, 2009
2
Global Asset Allocation
The J.P. Morgan View
The economy
• A sustained upward trajectory in global growth momentum appears to have
been broken in September. Our global manufacturing PMI survey stalled last
month and the new orders index moved lower, following solid increases in both
in each previous month this year. Global car sales also look to have begun a
correction last month after having rocketed up 33% this year to a new record
high. And the move towards stability in US labor markets was rudely interrupted
by the September employment reports.
• While disappointing, these developments do not point to a near-term weakening in growth. Our PMI survey along with a wide range of releases indicates
that global IP and GDP gains will likely remain strong into year end. What’s
more, there is every reason to expect a bumpy pattern of data releases to
emerge in an environment in which rates of growth accelerated sharply around
midyear and are now expected to level off. We thus maintain our view that a
foundation for a sustained global recovery is intact. Nonetheless, not all the
pillars are in place and the latest news provides reason to recognize the
downside risk.
Fixed income
• Government bonds backed up this week, getting back towards the middle of
its 5-month trading range. Slightly better data this week, and a nervous
reaction to the latest Bernanke speech contributed to today’s sell-off. Both
supply and demand for bonds are at record highs, but are keeping each other
in rough balance at the moment. We this continue to play the range, and focus
exposures on earning carry and outperformance of higher-yielding bonds.
Equities
• Equities rebounded sharply this week, erasing the losses of the previous two
weeks. The rebound was driven by a strong start in the Q3 US reporting
season. 81% of the 31 S&P 500 companies having reported so far have beaten
estimates. The average EPS beat was 18%.
EM vs DM equities
Relative total return index on y-axis using MSCI World$
and MSCI EM$ indices
210
MSCI EM$ vs World$
200
190
180
170
160
150
140
130
Jan-07 Jul-07
Jan-09 Jul-09
Global PMI new orders-to-stocks ratio
LHS is the new orders-to-stocks ratio and RHS is the
excess return index of global cyclical vs defensive
1.5
150
Global mfg PMI new orders-to-stocks ratio
140
1.3
130
1.1
120
0.9
110
100
• We project a Q3 EPS of $16.30 for the S&P500, 10% above the bottom-up
0.7
consensus of $14.82. This will represent the third consecutive quarter of
positive surprises. We are most bullish on Financials (beat by 25%) and
Cyclicals (beat by 10%).
0.5
• All eyes will be on the top line. Q2 bottom-line earnings surprised on the
Jan-08 Jul-08
Source: Datastream, J.P. Morgan
Global Cyclical vs Defensive
90
80
98
00
02
04
06
08
Source: Datastream, J.P. Morgan
upside, but top-line revenues came in slightly below consensus. The market is
now looking for signs that not only cost-cutting but also revenues are driving
the profit recovery. We project that top line will beat by 1% in Q3 for the
S&P500, led by Financials (5%), Energy (5%-10%), and Technology (1%).
• Pre-announcements are also supportive of a positive surprise in Q3. Q3 saw
the highest level of positive pre-announcements since 2006. Meanwhile,
negative pre-announcements are at the lowest level in 10 years.
• Q3 results should validate a trajectory toward our 2010 $75 EPS. The $75 EPS
forecast for 2010 would only match the 2002 expansion. Cost-cutting by
corporates this cycle was 20% greater than in 2002, and we expect a stronger
GDP recovery than that seen after the 1991 and 2001 recessions. For more
details, see 3Q09 Preview: The Bar Is Higher, Tom Lee, Oct 8.
Oct 9, 2009
More details in ...
EM Corporate Outlook and Strategy, Victoria Miles et al.
US Credit Markets Outlook and Strategy, Eric Beinstein et al.
High Yield Credit Markets Weekly, Peter Acciavatti et al.
European Credit Outlook & Strategy, Steven Dulake et al.
3
Global Asset Allocation
The J.P. Morgan View
Credit
• Retail demand of HG bonds has accelerated further. The current 4-week
average inflow into US HG bond funds reached more than $5bn per week ,
the strongest since data are available in 1992. Stay overweight US HG.
• Higher rated CMBS should continue to gain over the next 6 months. We stay
overweight super senior CMBS. Thus far, $3bn of PPIP investment funds
has been raised from private investors, which creates $12bn of purchasing
power. We expect PPIP funds to start investing this month, restarting the
tightening trend.
Foreign Exchange
• Despite the impressiveness of earnings, the sense that markets are overshooting is as prevalent in FX as it is in equities and credit. But just as
record returns since March do not make stocks or credit expensive, neither
do record runs in most currency pairs. Based on regressions of currencies
on cyclical drivers such as rates spreads and commodity prices, several
currencies are at least 5% misaligned. Those trading at least 5% too strong
are NZD/USD (12%), AUD/USD (6%) and EUR/GBP (5%). Those trading at
least 5% too weak are USD/JPY (-6%) and GBP/USD (-5.4%). Given the
standard error of the models, only NZD/USD and USD/JPY are meaningfully
misaligned. And counter to the conventional view, EUR/USD is not very
stretched even at current levels (only 3% rich on the two-year regression),
and EUR/NOK sits at fair value even after a 9% collapse in Q3.
• Of course valuations only matter when fundamentals change, which is
economists’ perversion of Newton’s Law – objects stay in motion until acted
upon by another force. Reversals in commodity currencies were prompted
by external shocks or policy shifts such as the 120bp sell-off in US Treasuries in spring 2004 in anticipation of Fed tightening; the subsequent lift in
Fed funds from 1% to 5.25% from 2004 to 2006; the onset of the credit crisis
in 2007; and the initiation of RBA/RBNZ easing cycles in 2008.
US gross issuance
$bn, Gov’t. guaranteed issues are in dark blue
150
120
MTD
90
60
30
0
Jan-08
Jul-08
Jan-09
Jul-09
Source: J.P. Morgan
FX weekly change vs USD
5%
4%
3%
2%
1%
0%
-1%
USD EUR GBP JPY CHF CAD AUD
TWI
Source: J.P. Morgan
• Given that such event risks are unlikely this year, there is little urgency to
reduce dollar shorts. Stay long cyclical currencies and short the dollar, but
be discriminating. Add short USD/CAD and GBP/CAD to existing shorts in
USD/JPY, NZD/NOK, EUR/NOK and GBP/NOK. Stay long EUR/GBP and
NOK/SEK.
Alternatives
• Commodities rallied this week, with industrial metals gaining almost 7%. We
maintain an overall neutral allocation. Our tactical short in WTI is offset by
long positions in base metals and now in agricultural products, particularly
sugar and cocoa. Disinflation risk is a negative for the asset class; investor/
hedger’s interest in inflation protection is likely to go down. The global
recovery will, however, limit near-term downside.
More details in ...
Alternative Investments Outlook and Strategy
FX Markets Weekly, John Normand et al.
• Hedge funds continue to perform well. The major indices suggest they made
2.8% last month. Emerging Markets, Distressed, Convertible Arb and Equity
Long-Short performed best. The latter three are our top picks for the remainder of the year. Last month, we upgraded Distressed Securities to overweight after almost two years of underweight or neutral recommendations.
HY market fundamentals continue to improve, particularly in the US. We
expect the US HY default rate to collapse to 4% in 2010.
Oct 9, 2009
Energy Monthly, Lawrence Eagles et al.
Metals Review and Outlook, Michael Jansen
Global Metals Quarterly, Michael Jansen
Grains & Oilseeds Monthly, Lewis Hagedorn
4
Global Asset Allocation
The J.P. Morgan View
Interest rates
Current
Dec-09
Mar-10
Jun-10
Sep-10
United States
Fed funds rate
0.125
0.125
0.125
0.125
0.125
10-year yields
3.37
3.50
3.75
4.00
4.25
Euro area
Refi rate
1.00
1.00
1.00
1.00
1.00
10-year yields
3.21
3.20
3.30
3.35
3.40
United Kingdom
Repo rate
0.50
0.50
0.50
0.75
1.00
10-year yields
3.45
3.70
3.95
4.10
4.30
Japan
Overnight call rate
0.10
0.10
0.10
0.10
0.10
10-year yields
1.28
1.45
1.40
1.30
1.40
Credit Markets
Current
US high grade (bp over UST)
206
US high grade (bp over swaps)
186
Euro high grade all (bp over swaps)
112
YTD Return*
-2.2%
2.4%
2.6%
0.6%
Index
YTD Return*
JPMorgan US Index (JULI)
15.8%
JPMorgan Euro Credit Index (MAGGIE)
13.5%
USD high yield (bp vs. UST)
780
JPMorgan Global High Yield Index
50.0%
Euro high yield (bp over Euro gov)
814
JPMorgan Euro Credit Index (MAGGIE)
64.9%
EMBIG (bp vs. UST)
305
EMBI Global
28.4%
Current
09Q4
10Q1
10Q2
10Q3
JPMCCI Index
71.4
70.0
70.0
65.0
70.0
Energy
5.6%
Quarterly Averages
Commodities
WTI ($/bbl)
YTD Return*
Gold ($/oz)
1048
1000
-
-
-
Precious Metals
18.6%
Copper ($/metric ton)
6312
5950
-
-
-
Industrial Metals
57.1%
Corn ($/Bu)
3.66
3.65
4.00
4.15
4.05
Agriculture
0.4%
Current
Dec-09
Mar-10
Jun-10
Sep-10
Foreign Exchange
3m cash YTD Return*
index
in USD
EUR/USD
1.47
1.50
1.50
1.47
1.45
EUR
USD/JPY
89.7
89
91
97
100
JPY
8.4%
3.3%
GBP/USD
1.59
1.63
1.60
1.58
1.58
GBP
14.3%
AUD/USD
0.90
0.90
0.92
0.93
0.94
AUD
34.0%
USD/CAD
1.04
1.06
1.04
1.03
1.02
CAD
18.5%
NZD/USD
0.73
0.71
0.72
0.72
0.73
NZD
30.3%
YTD Return
Equities
Current
(local ccy)
Sector Allocation *
US
YTD ($)
S&P
1068
18.2%
Energy
OW
11.8%
Europe YTD ($)
UW
38.7%
Japan
Topix
898
4.5%
Materials
OW
40.7%
N
72.8%
FTSE 100
5162
16.4%
Industrials
OW
14.5%
OW
46.3%
N
11.5%
N
55.6%
MSCI Eurozone*
158
26.2%
Discretionary
OW
31.2%
OW
35.0%
N
29.2%
OW
94.8%
N
YTD (¥)
EM
13.7%
UW
YTD ($)
81.0%
19.8%
N
92.8%
MSCI Europe*
1092
24.3%
Staples
UW
11.2%
UW
30.2%
UW
-9.4%
UW
9.5%
DAX
5712
18.7%
Healthcare
UW
9.3%
UW
16.1%
UW
-9.9%
UW
28.1%
CAC
3800
18.1%
Financials
OW
22.6%
N
57.7%
OW
-8.6%
OW
76.3%
MSCI EM*
40967
54.2%
Information Tech.
OW
46.6%
N
43.3%
N
10.4%
OW
84.8%
940
69.6%
Telecommunications
N
-1.0%
OW
19.0%
N
-10.5%
UW
29.3%
UW
3.6%
OW
11.0%
UW
-20.5%
UW
51.1%
MSCI EM $*
*Levels/returns as of Oct 8, 2009
Utilities
Source: Bloomberg, Datastream, IBES, Standard & Poor's Services, J.P. Morgan estimates
Oct 9, 2009
5
Global Asset Allocation
The J.P. Morgan View
Global Economic Outlook Summary
Real GDP
Real GDP
% over a year ago
Consumer prices
% over previous period, saar
% over a year ago
2008
2009
2010
1Q09
2Q09
3Q09
4Q09
1Q10
2Q10
3Q10
2Q09
4Q09
2Q10
4Q10
The Americas
United States
Canada
Latin America
Argentina
Brazil
Chile
Colombia
Ecuador
Mexico
Peru
Venezuela
0.4
0.4
3.8
6.8
5.1
3.2
2.4
6.5
1.3
9.8
4.8
-2.4
-2.4
-3.0
-4.5
0.0
-1.5
-0.5
-1.0
-6.5
1.0
-1.5
3.2
2.6
4.5
2.5
5.0
5.0
3.0
1.5
5.0
5.4
2.5
-6.4
-6.1
-10.0
0.2
-3.8
-3.0
1.1
-5.1
-21.2
-6.3
-7.3
-0.7
-3.4
0.8
1.1
7.8
-1.4
2.7
-1.0
-4.4
-1.6
-3.3
4.0
2.0
7.7
-10.0
6.5
8.0
1.9
-2.0
15.5
8.0
0.0
3.0
3.0
4.1
-4.0
5.0
6.0
3.2
0.0
5.0
13.0
2.0
3.0
3.0
5.2
12.0
4.3
6.0
3.5
2.0
5.0
3.0
3.0
4.0
3.0
4.9
10.0
5.0
5.0
4.3
2.5
4.0
3.5
4.0
4.0
3.5
3.8
6.0
4.0
3.0
5.5
4.0
3.0
3.5
4.0
-0.9
0.1
6.7
5.5
5.2
3.1
4.8
5.5
6.0
4.0
28.2
1.2
1.3
5.4
6.0
4.2
-1.5
3.3
3.5
4.0
1.1
29.5
2.0
1.9
6.2
10.0
4.5
2.0
3.9
2.4
3.3
1.5
36.4
0.9
2.3
6.5
10.2
4.7
3.0
4.3
4.0
3.5
2.0
37.1
Asia/Pacific
Japan
Australia
New Zealand
Asia ex Japan
China
Hong Kong
India
Indonesia
Korea
Malaysia
Philippines
Singapore
Taiwan
Thailand
-0.7
2.4
0.1
5.8
9.0
2.4
6.1
6.1
2.2
4.6
3.8
1.1
0.1
2.6
-5.6
1.0
-1.3
3.9
8.4
-2.6
6.0
4.1
-0.8
-3.0
1.5
-1.8
-3.8
-3.1
2.2
2.9
2.8
7.2
9.5
5.3
7.5
5.0
4.0
5.0
5.0
6.5
5.5
6.1
-12.4
1.6
-3.0
2.5
8.3
-16.1
8.2
5.4
0.5
-17.7
-8.1
-12.2
-10.2
-7.2
2.3
2.5
0.3
12.6
14.9
13.9
6.7
3.8
11.0
12.8
10.0
20.7
20.7
9.6
3.0
1.2
2.5
7.5
9.5
9.0
5.2
4.0
4.0
6.1
4.0
14.8
9.5
7.0
2.5
3.8
2.1
6.7
9.1
5.0
5.6
4.0
3.5
4.5
4.0
2.0
8.0
5.3
2.5
2.1
2.6
6.5
9.0
4.2
7.0
5.0
3.5
1.6
5.0
4.0
3.0
4.9
1.5
2.4
4.3
7.0
9.5
4.0
7.7
6.0
3.5
4.9
5.0
5.3
3.0
5.7
1.5
4.4
3.4
6.9
9.3
3.8
8.3
6.0
3.5
4.9
5.0
6.1
2.0
7.0
-1.0
1.5
1.9
1.3
-1.5
-0.1
8.9
5.6
2.8
1.3
3.2
-0.5
-0.8
-2.8
-2.0
1.5
1.8
2.0
0.9
-0.4
7.4
2.4
2.5
-1.2
3.0
-0.8
-1.0
1.4
-2.2
1.9
1.6
3.5
3.2
0.6
6.3
4.6
3.0
0.5
3.6
1.9
1.8
4.6
-1.5
2.6
1.7
3.2
2.7
2.1
4.7
6.0
3.3
1.5
3.7
1.8
2.1
4.0
Africa/Middle East
Israel
South Africa
4.0
3.1
0.0
-2.0
3.0
3.0
-3.2
-6.4
1.0
-3.0
1.5
0.6
2.5
3.4
3.0
4.5
3.0
3.7
3.0
3.6
3.2
7.7
3.3
6.3
3.4
4.5
3.3
4.1
Europe
Euro area
Germany
France
Italy
Norway
Sweden
Switzerland
United Kingdom
Emerging Europe
Bulgaria
Czech Republic
Hungary
Poland
Romania
Russia
Turkey
0.6
1.0
0.3
-1.0
2.5
-0.4
1.8
0.6
4.1
6.1
2.7
0.6
4.9
7.1
5.6
0.9
-3.7 ↓
-4.6
-2.0
-4.9
-1.1
-4.5
-1.3
-4.4 ↓
-5.3
-5.0
-4.0
-6.2
1.2
-6.0
-8.5
-5.3
2.6 ↓
3.6
2.7
1.5
2.8
3.2
2.2
2.0 ↓
3.9
-1.5
2.5
1.0
3.0
2.0
5.0
5.0
-9.6 ↓
-13.4
-5.4
-10.4
-5.0
-3.7
-3.5
-9.6
-19.3
…
-17.9
-10.0
1.2
…
-33.6
…
-0.7 ↓
1.3
1.1
-2.0
1.3
0.6
-1.0
-2.3
1.9
…
0.4
-7.9
2.0
…
4.9
…
3.0
5.0
2.8
1.5
2.5
1.0
1.8
0.5 ↓
5.4
…
4.5
-2.0
2.2
…
9.0
…
2.5
4.0
2.5
1.0
3.0
4.0
2.3
3.0
4.7
…
5.0
2.0
2.5
…
6.5
…
3.0
3.5
3.0
2.0
3.0
4.0
2.5
2.0
3.5
…
2.8
2.0
3.2
…
4.5
…
3.0
3.5
3.0
2.0
3.0
3.5
2.5
2.5
3.3
…
2.5
2.0
3.5
…
4.0
…
3.0
3.5
3.0
2.0
3.0
3.5
3.0
2.8
3.3
…
2.2
2.5
3.5
…
4.0
…
0.2
0.2
-0.2
0.9
3.1
-0.4
-0.7
2.1
7.7
…
1.4
3.6
3.7
6.1
12.6
5.7
0.3
0.3
0.6
1.0
1.2
-0.2
-0.3
2.2 ↑
6.8
…
1.0
5.5
3.7
6.0
10.6
5.0
0.9
0.5
1.0
1.4
1.0
0.9
0.7
2.3 ↑
6.3
…
2.7
3.9
2.7
6.2
9.1
6.3
1.2
0.3
0.7
1.0
0.4
0.5
0.7
1.4 ↓
6.0
…
3.4
2.4
2.5
6.5
9.2
5.2
Global
Developed markets
Emerging markets
1.3
0.4
4.9
-2.5
-3.3
0.5
3.4
2.8
5.8
-7.5 ↓
-8.3 ↓
-3.9
1.3
-0.4 ↓
7.5
3.9 ↓
3.1 ↓
7.0
3.4
2.8
5.6
3.4
2.8
5.6
3.7
3.1
5.7
3.7
3.2
5.5
0.6
-0.3
3.8
1.1
0.5 ↑
3.7
1.7
1.0
4.5
1.5
0.7
4.4
Source: J.P. Morgan
Oct 9, 2009
6
Global Asset Allocation
The J.P. Morgan View
Analyst certification: The research analyst(s) denoted by an “AC” on the cover of this report (or, where multiple research analysts are primarily
responsible for this report, the research analyst denoted by an “AC” on the cover or within the document individually certifies, with respect to each
security or issuer that the research analyst covers in this research) that: (1) all of the views expressed in this report accurately reflect his or her
personal views about any and all of the subject securities or issuers; and (2) no part of any of the research analyst’s compensation was, is, or will be
directly or indirectly related to the specific recommendations or views expressed by the research analyst(s) in this report. Explanation of Ratings:
Ratings System: J.P. Morgan uses the following sector/issuer portfolio weightings: Overweight (over the next three months, the recommended risk
position is expected to outperform the relevant index, sector, or benchmark), Neutral (over the next three months, the recommended risk position
is expected to perform in line with the relevant index, sector, or benchmark), and Underweight (over the next three months, the recommended risk
position is expected to underperform the relevant index, sector, or benchmark). J.P. Morgan’s Emerging Market research uses a rating of Marketweight,
which is equivalent to a Neutral rating. Valuation & Methodology: In J.P. Morgan’s credit research, we assign a rating to each issuer (Overweight,
Underweight or Neutral) based on our credit view of the issuer and the relative value of its securities, taking into account the ratings assigned to the
issuer by credit rating agencies and the market prices for the issuer’s securities. Our credit view of an issuer is based upon our opinion as to whether
the issuer will be able service its debt obligations when they become due and payable. We assess this by analyzing, among other things, the issuer’s credit
position using standard credit ratios such as cash flow to debt and fixed charge coverage (including and excluding capital investment). We also analyze
the issuer’s ability to generate cash flow by reviewing standard operational measures for comparable companies in the sector, such as revenue and
earnings growth rates, margins, and the composition of the issuer’s balance sheet relative to the operational leverage in its business. Analysts’
Compensation: The research analysts responsible for the preparation of this report receive compensation based upon various factors, including the
quality and accuracy of research, client feedback, competitive factors and overall firm revenues. The firm’s overall revenues include revenues from
its investment banking and fixed income business units.
Other Disclosures: J.P. Morgan is the global brand name for J.P. Morgan Securities Inc. (JPMSI) and its non-US affiliates worldwide. Options
related research: If the information contained herein regards options related research, such information is available only to persons who have
received the proper option risk disclosure documents. For a copy of the Option Clearing Corporation’s Characteristics and Risks of Standardized
Options, please contact your J.P. Morgan Representative or visit the OCC’s website at http://www.optionsclearing.com/publications/risks/riskstoc.pdf.
Legal Entities Disclosures: U.S.: JPMSI is a member of NYSE, FINRA and SIPC. J.P. Morgan Futures Inc. is a member of the NFA. JPMorgan
Chase Bank, N.A. is a member of FDIC and is authorized and regulated in the UK by the Financial Services Authority. U.K.: J.P. Morgan Securities
Ltd. (JPMSL) is a member of the London Stock Exchange and is authorised and regulated by the Financial Services Authority. Registered in England
& Wales No. 2711006. Registered Office 125 London Wall, London EC2Y 5AJ. South Africa: J.P. Morgan Equities Limited is a member of the
Johannesburg Securities Exchange and is regulated by the FSB. Hong Kong: J.P. Morgan Securities (Asia Pacific) Limited (CE number AAJ321) is
regulated by the Hong Kong Monetary Authority and the Securities and Futures Commission in Hong Kong. Korea: J.P. Morgan Securities (Far East)
Ltd, Seoul branch, is regulated by the Korea Financial Supervisory Service. Australia: J.P. Morgan Australia Limited (ABN 52 002 888 011/AFS
Licence No: 238188) is regulated by ASIC and J.P. Morgan Securities Australia Limited (ABN 61 003 245 234/AFS Licence No: 238066) is a Market
Participant with the ASX and regulated by ASIC. Taiwan: J.P.Morgan Securities (Taiwan) Limited is a participant of the Taiwan Stock Exchange
(company-type) and regulated by the Taiwan Securities and Futures Bureau. India: J.P. Morgan India Private Limited is a member of the National
Stock Exchange of India Limited and Bombay Stock Exchange Limited and is regulated by the Securities and Exchange Board of India. Thailand:
JPMorgan Securities (Thailand) Limited is a member of the Stock Exchange of Thailand and is regulated by the Ministry of Finance and the Securities
and Exchange Commission. Indonesia: PT J.P. Morgan Securities Indonesia is a member of the Indonesia Stock Exchange and is regulated by the
BAPEPAM. Philippines: J.P. Morgan Securities Philippines Inc. is a member of the Philippine Stock Exchange and is regulated by the Securities and
Exchange Commission. Brazil: Banco J.P. Morgan S.A. is regulated by the Comissao de Valores Mobiliarios (CVM) and by the Central Bank of Brazil.
Mexico: J.P. Morgan Casa de Bolsa, S.A. de C.V., J.P. Morgan Grupo Financiero is a member of the Mexican Stock Exchange and authorized to
act as a broker dealer by the National Banking and Securities Exchange Commission. Singapore: This material is issued and distributed in Singapore
by J.P. Morgan Securities Singapore Private Limited (JPMSS) [MICA (P) 132/01/2009 and Co. Reg. No.: 199405335R] which is a member of the
Singapore Exchange Securities Trading Limited and is regulated by the Monetary Authority of Singapore (MAS) and/or JPMorgan Chase Bank, N.A.,
Singapore branch (JPMCB Singapore) which is regulated by the MAS. Malaysia: This material is issued and distributed in Malaysia by JPMorgan
Securities (Malaysia) Sdn Bhd (18146-X) which is a Participating Organization of Bursa Malaysia Berhad and a holder of Capital Markets Services
License issued Securities Bhd and is licensed as a dealer by the Securities Commission in Malaysia. Pakistan: J. P. Morgan Pakistan Broking (Pvt.)
Ltd is a member of the Karachi Stock Exchange and regulated by the Securities and Exchange Commission of Pakistan. Saudi Arabia:
J.P.Morgan Saudi Arabia Ltd. is authorised by the Capital Market Authority of the Kingdom of Saudi Arabia (CMA) to carry out dealing as an agent,
arranging, advising and custody, with respect to securities business under licence number 35-07079 and its registered address is at 8th Floor, AlFaisaliyah Tower, King Fahad Road, P.O. Box 51907, Riyadh 11553, Kingdom of Saudi Arabia. Country and Region Specific Disclosures: U.K.
and European Economic Area (EEA): Unless specified to the contrary, issued and approved for distribution in the U.K. and the EEA by JPMSL.
Investment research issued by JPMSL has been prepared in accordance with JPMSL’s policies for managing conflicts of interest arising as a result
of publication and distribution of investment research. Many European regulators require that a firm to establish, implement and maintain such
a policy. This report has been issued in the U.K. only to persons of a kind described in Article 19 (5), 38, 47 and 49 of the Financial Services and
Markets Act 2000 (Financial Promotion) Order 2005 (all such persons being referred to as “relevant persons”). This document must not be acted
on or relied on by persons who are not relevant persons. Any investment or investment activity to which this document relates is only available
to relevant persons and will be engaged in only with relevant persons. In other EEA countries, the report has been issued to persons regarded as
professional investors (or equivalent) in their home jurisdiction. Australia: This material is issued and distributed by JPMSAL in Australia to
“wholesale clients” only. JPMSAL does not issue or distribute this material to “retail clients.” The recipient of this material must not distribute
it to any third party or outside Australia without the prior written consent of JPMSAL. For the purposes of this paragraph the terms “wholesale
client” and “retail client” have the meanings given to them in section 761G of the Corporations Act 2001. Germany: This material is distributed
in Germany by J.P. Morgan Securities Ltd., Frankfurt Branch and J.P.Morgan Chase Bank, N.A., Frankfurt Branch which are regulated by the
Bundesanstalt für Finanzdienstleistungsaufsicht. Hong Kong: The 1% ownership disclosure as of the previous month end satisfies the
requirements under Paragraph 16.5(a) of the Hong Kong Code of Conduct for persons licensed by or registered with the Securities and Futures
Commission. (For research published within the first ten days of the month, the disclosure may be based on the month end data from two months’
prior.) J.P. Morgan Broking (Hong Kong) Limited is the liquidity provider for derivative warrants issued by J.P. Morgan International Derivatives
Ltd and listed on The Stock Exchange of Hong Kong Limited. An updated list can be found on HKEx website: http://www.hkex.com.hk/prod/dw/
Lp.htm. Japan: There is a risk that a loss may occur due to a change in the price of the shares in the case of share trading, and that a loss may
occur due to the exchange rate in the case of foreign share trading. In the case of share trading, JPMorgan Securities Japan Co., Ltd., will be
receiving a brokerage fee and consumption tax (shouhizei) calculated by multiplying the executed price by the commission rate which was
Oct 9, 2009
7
Global Asset Allocation
The J.P. Morgan View
individually agreed between JPMorgan Securities Japan Co., Ltd., and the customer in advance. Financial Instruments Firms: JPMorgan Securities
Japan Co., Ltd., Kanto Local Finance Bureau (kinsho) No. 82 Participating Association / Japan Securities Dealers Association, The Financial
Futures Association of Japan. Korea: This report may have been edited or contributed to from time to time by affiliates of J.P. Morgan Securities
(Far East) Ltd, Seoul branch. Singapore: JPMSS and/or its affiliates may have a holding in any of the securities discussed in this report; for
securities where the holding is 1% or greater, the specific holding is disclosed in the Important Disclosures section above. India: For private
circulation only, not for sale. Pakistan: For private circulation only, not for sale. New Zealand: This material is issued and distributed by
JPMSAL in New Zealand only to persons whose principal business is the investment of money or who, in the course of and for the purposes of
their business, habitually invest money. JPMSAL does not issue or distribute this material to members of “the public” as determined in accordance
with section 3 of the Securities Act 1978. The recipient of this material must not distribute it to any third party or outside New Zealand without
the prior written consent of JPMSAL. General: Additional information is available upon request. Information has been obtained from sources
believed to be reliable but JPMorgan Chase & Co. or its affiliates and/or subsidiaries (collectively J.P. Morgan) do not warrant its completeness or
accuracy except with respect to any disclosures relative to JPMSI and/or its affiliates and the analyst’s involvement with the issuer that is the subject
of the research. All pricing is as of the close of market for the securities discussed, unless otherwise stated. Opinions and estimates constitute our
judgment as of the date of this material and are subject to change without notice. Past performance is not indicative of future results. This material
is not intended as an offer or solicitation for the purchase or sale of any financial instrument. The opinions and recommendations herein do not take
into account individual client circumstances, objectives, or needs and are not intended as recommendations of particular securities, financial
instruments or strategies to particular clients. The recipient of this report must make its own independent decisions regarding any securities or
financial instruments mentioned herein. JPMSI distributes in the U.S. research published by non-U.S. affiliates and accepts responsibility for its
contents. Periodic updates may be provided on companies/industries based on company specific developments or announcements, market conditions
or any other publicly available information. Clients should contact analysts and execute transactions through a J.P. Morgan subsidiary or affiliate in
their home jurisdiction unless governing law permits otherwise. “Other Disclosures” last revised January 30, 2009. Copyright 2009 JPMorgan
Chase & Co. All rights reserved. This report or any portion hereof may not be reprinted, sold or redistributed without the written
consent of J.P. Morgan.
Oct 9, 2009
8


