Test 13B
advertisement

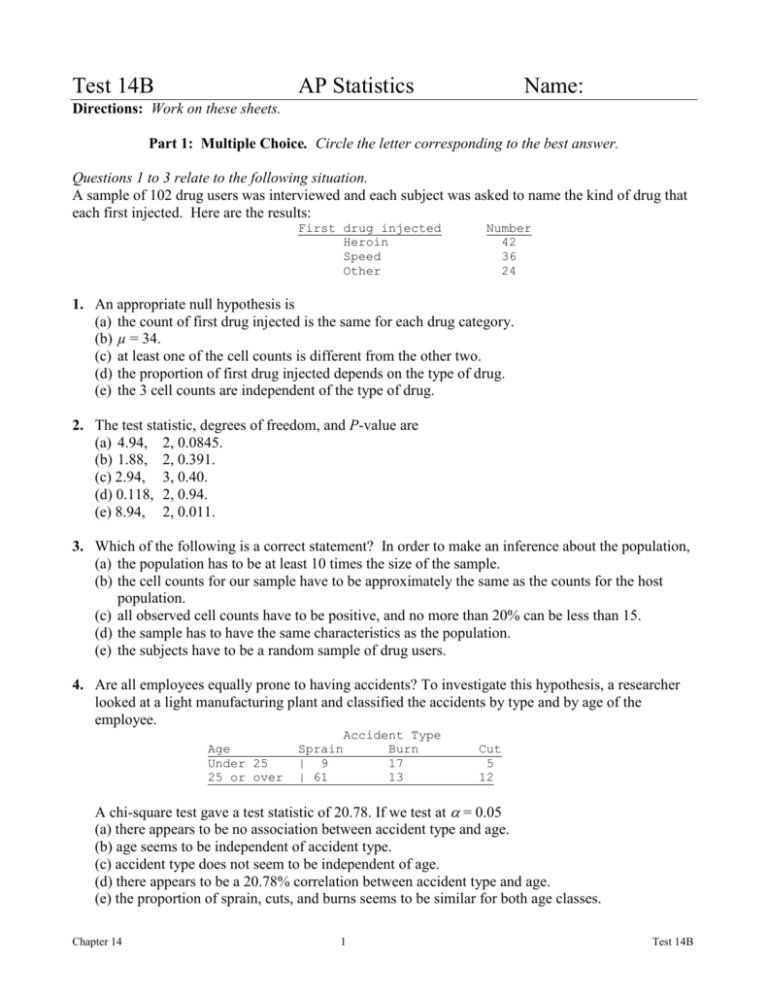
Test 14B AP Statistics Name: Directions: Work on these sheets. Part 1: Multiple Choice. Circle the letter corresponding to the best answer. Questions 1 to 3 relate to the following situation. A sample of 102 drug users was interviewed and each subject was asked to name the kind of drug that each first injected. Here are the results: First drug injected Heroin Speed Other Number 42 36 24 1. An appropriate null hypothesis is (a) the count of first drug injected is the same for each drug category. (b) µ = 34. (c) at least one of the cell counts is different from the other two. (d) the proportion of first drug injected depends on the type of drug. (e) the 3 cell counts are independent of the type of drug. 2. The test statistic, degrees of freedom, and P-value are (a) 4.94, 2, 0.0845. (b) 1.88, 2, 0.391. (c) 2.94, 3, 0.40. (d) 0.118, 2, 0.94. (e) 8.94, 2, 0.011. 3. Which of the following is a correct statement? In order to make an inference about the population, (a) the population has to be at least 10 times the size of the sample. (b) the cell counts for our sample have to be approximately the same as the counts for the host population. (c) all observed cell counts have to be positive, and no more than 20% can be less than 15. (d) the sample has to have the same characteristics as the population. (e) the subjects have to be a random sample of drug users. 4. Are all employees equally prone to having accidents? To investigate this hypothesis, a researcher looked at a light manufacturing plant and classified the accidents by type and by age of the employee. Age Under 25 25 or over Sprain | 9 | 61 Accident Type Burn 17 13 Cut 5 12 A chi-square test gave a test statistic of 20.78. If we test at = 0.05 (a) there appears to be no association between accident type and age. (b) age seems to be independent of accident type. (c) accident type does not seem to be independent of age. (d) there appears to be a 20.78% correlation between accident type and age. (e) the proportion of sprain, cuts, and burns seems to be similar for both age classes. Chapter 14 1 Test 14B 5. Each person in a random sample of 50 was asked to state his/her sex and preferred color. The resulting frequencies are shown below. Male Female Red 5 15 Color Blue Green 14 6 6 4 A chi-square test is used to test the null hypothesis that sex and preferred color are independent. Which of the following statements is a correct decision about the null hypothesis? (a) Reject at the 0.005 level. (b) Reject at the 0.01 level but not at the 0.005 level. (c) Reject at the 0.025 level but not at the 0.01 level. (d) Reject at the 0.05 level but not at the 0.025 level. (e) Accept at the 0.05 level. 6. The following data were obtained from a company that manufactures special plastic containers that are to hold a specified volume of hazardous material. On each of the three 8-hour shifts workers are able to make 500 of the containers. Some containers do not meet specifications as required by the company’s customer because they are too small; others, because they are too large. Shift 8 am 4 pm Midnight Too small 36 24 12 Conformance to Specification Within spec. Too large 452 12 443 33 438 50 If conformance to specifications is independent of shift, the expected number of containers that meet specifications on the 4 pm shift is (a) 166.7. (b) 443. (c) 33. (d) 444.3. (e) 500. 7. A survey was conducted to investigate whether alcohol consumption and smoking are related. The following information was compiled for 600 individuals: Drinker Nondrinker Smoker 193 89 Nonsmoker 165 153 Which of the following statements is true? (a) The appropriate alternative hypothesis is Ha: Smoking and alcohol consumption are independent. (b) The appropriate null hypothesis is H0: Smoking and alcohol consumption are not independent. (c) The calculated value of the test statistic is 3.84. (d) The calculated value of the test statistic is 7.86. (e) At level 0.01 we conclude that smoking and alcohol consumption are related. Chapter 14 2 Test 14B Part 2: Free Response Answer completely, but be concise. Write sequentially and show all steps. 8. Your school administration wants to install new soft drink machines in the gym and cafeteria. Their market analysts want to know if flavor preference depends on the location. A random sample of 180 students was selected and interviewed. Their location and soft drink preference are given in the table. Soft drink Coca-Cola Pepsi Sprite Gym 33 30 5 Cafeteria 57 20 35 (a) Enter the marginal values in the table and the expected counts next to the observed counts. (b) Write null and alternative hypotheses for a chi-square analysis of these data. (c) State and verify conditions for carrying out the inference procedure. (d) Determine the test statistic, the degrees of freedom, and the P-value. (e) State your conclusion(s). Chapter 14 3 Test 14B 9. The M&M/Mars Company reports that their Peanut M&M’s Chocolate Candies are produced in the following distribution: 20% each of browns, yellows, reds and blues, and 10% each of greens and oranges. Sam bought a bag of Peanut M&M’s and counted out the following distribution of colors: 12 brown, 7 yellow, 4 red, 8 blue, 13 green and 2 orange. Perform a goodness of fit test of the company’s reported distribution and report your results. Do a complete analysis, that is, include all of the important steps. I pledge that I have neither given nor received aid on this test.____________________________________________ Chapter 14 4 Test 14B Test 14C AP Statistics Name: Directions: Work on these sheets. Part 1: Multiple Choice. Circle the letter corresponding to the best answer. Questions 1 to 5 relate to the following situation. A well-known chewing gum maker wants to determine if people who chew gum have a preference of flavors. A random sample of sales is selected. Here are the results: Flavor Number sold Peppermint 25 Cinnamon 19 Wintergreen 22 Spearmint 14 1. An appropriate null hypothesis for a significance test would be (a) µ = 20 (b) There is a flavor preference. (c) The cell counts (above) are independent of flavor. (d) At least one of the cell counts (above) is different from the other three. (e) There is no flavor preference. 2. Which of the following are conditions for a chi-square test? I. There have to be at least 800 gum chewers in the population. II. If p = proportion of gum chewers, then np ≥ 10 and n(1 – p) ≥ 10. III. All of the cell counts (above) have to be at least 5. IV. The sample has to be random. (a) (b) (c) (d) (e) I and III only II and IV only IV only I and IV only III and IV only 3. The expected counts and degrees of freedom are (a) 25, 19, 22, 14; 3 (b) 25, 19, 22, 14; 4 (c) 20, 20, 20, 20; 4 (d) 18, 18, 18, 18; 3 (e) 20, 20, 20, 20; 3 4. The test statistic and P-value are (a) X2 = 3.3; and P = 0.348. (b) X2 = 0 and P =1. (c) X2 = 5.2 and P = 0.158. (d) X2 = 7.7 and P = 0.053. (e) None of the above is correct. Chapter 14 5 Test 14B 5. An appropriate interpretation of this inference procedure is (a) gum chewers prefer peppermint flavor. (b) unfortunately, one or more of the conditions for inference is violated, so we can’t conclude anything from this study. (c) the P-value is so large that H0 can be rejected. There is no gum preference. (d) there is insufficient evidence that gum chewers have a preference among these four flavors. (e) there is sufficient evidence of a gum preference. An additional inference procedure would need to be done to determine which flavor is preferred. 6. A controversial issue in sports is the use of the “instant replay” for making decisions on plays that are extremely close or hard to call by an official. A random survey of players in each of four professional sports was conducted, asking them if they felt instant replays should be used to decide close or controversial calls. The results are as follows: Use of Instant Replay Favor Oppose Football 22 2 Baseball 18 6 Basketball 15 26 Soccer 3 10 In testing to see whether opinion with respect to the use of instant replays is independent of sport, a table of expected frequencies is found. In this table, the expected number of professional baseball players opposing the use of instant replays is equal to: (a) 10.4 (b) 24.1 (c) 11.0 (d) 6.0 (e) 8.4 7. In the context of the previous problem, software gives the test statistic as X2 = 28.0 and the P-value as 0.000. Which of the following statements is correct? (a) We cannot proceed with inference because two of the entries are less than 5. (b) The purpose of the study is to see if professional athletes’ opinion of instant replays depends on which sport they play. (c) The number of the degrees of freedom is 8 – 1 = 7. (d) According to the central limit theorem, the sample size is large enough to permit us to use the Normal distribution. (e) The small P-value (0.000) tells us that there is evidence of a strong association between professional sports and opinions of the use of instant replays. Chapter 14 6 Test 14B 8. A random sample of 100 members of a union is asked to respond to two questions: Question 1. Are you happy with your financial situation? Question 2. Do you approve of the federal government’s economic policies? The responses are: Question 2 Question Yes Yes 22 No 12 Total 34 1 No 48 18 66 Total 70 30 100 To test the null hypothesis that response to Question 1 is independent of response to Question 2 at 5% level, the expected frequency for the cell (Yes, Yes) and the critical value of the associated test statistic are (a) 23.8 and 1.96 respectively. (b) 10.2 and 3.84 respectively. (c) 23.8 and 3.84 respectively. (d) 23.8 and 7.81 respectively. (e) 10.2 and 7.81 respectively. Part 2: Free Response Communicate your thinking clearly and completely. 9. A recent estimate by a large distributor of gasoline claims that 60% of all cars stopping at their service stations chose unleaded gas and that super unleaded and regular were each selected 20% of the time. In order to check the validity of these proportions, a study was conducted of cars stopping at the distributor’s service stations in a large city. The results were as follows: Regular 51 Gasoline Selected Unleaded Super Unleaded 261 88 Carry out a significance test of the distributor’s claim. Follow the steps in the Inference Toolbox. Chapter 14 7 Test 14B 10. A study was performed to examine the personal goals of children in grades 4, 5, and 6. A random sample of students was selected from schools in Georgia. The students received a questionnaire regarding achieving personal goals. They were asked what they would most like to do at school: make good grades, be good at sports, or be popular. Results are presented in the table below by the sex of the child. Make good grades Be popular Be good at sports Boys 96 32 94 Girls 295 45 40___ (a) Which type of chi-square procedure is appropriate in this setting? Justify your answer. (b) Carry out the inference procedure you selected in part (a). Follow the steps in the Inference Toolbox. I pledge that I have neither given nor received aid on this test. __________________________________________ Chapter 14 8 Test 14B Test 14D AP Statistics Name: Directions: Work on these sheets. A chi-square table appears at the end of this test. Part 1: Multiple Choice. Circle the letter corresponding to the best answer. Questions 1 through 10 relate to the following setting. The National Survey of Adolescent Health interviewed several thousand teens (grades 7 to 12). One question asked was “What do you think are the chances you will be married in the next ten years?” Here is a two-way table of the responses by sex: Almost no chance Some chance, but probably not A 50-50 chance A good chance Almost certain Female 119 150 447 735 1174 Male 103 171 512 710 756 1. The number of female teenagers in the sample is (a) 4877. (b) 2625. (c) 2252. (d) 1174. (e) 756. 2. The percent of the females in the sample who responded “almost certain” is about (a) 44.7%. (b) 39.6%. (c) 33.6%. (d) 24.1%. (e) 52.1%. 3. The percent of the females in the sample who responded “almost certain” is (a) higher than the percent of males who felt this way. (b) about the same as the percent of males who felt this way. (c) lower than the percent of males who felt this way. (d) higher than the percent of males who responded “a good chance” or “almost certain.” (e) higher than the other categories combined. 4. The expected count of females who respond “almost certain” is about (a) 464.6. (b) 891.2. (c) 777.8. (d) 891.2. (e) 1038.8. Chapter 14 9 Test 14B 5. The term in the chi-square statistic for the cell of females who respond “almost certain” is about (a) 20.5. (b) 15.6. (c) 0.1. (d) 17.6. (e) 0.13. 6. The degrees of freedom for the chi-square test for this two-way table are (a) 2. (b) 4. (c) 8. (d) 9. (e) 20. 7. The null hypothesis for the chi-square test for this two-way table is (a) Equal proportions of female and male teenagers are almost certain they will be married in ten years. (b) There is no difference between female and male teenagers in their opinions about their chances of being married in ten years. (c) There are equal numbers of female and male teenagers. (d) There is a difference between female and male teenagers in their opinions about their chances of being married in ten years. (e) There is no association between the number of female teens who responded “almost certain” and the number of male teens who feel this way. 8. The alternative hypothesis for the chi-square test for this two-way table is (a) Female and male teenagers do not have the same opinions about their chances of being married in ten years. (b) Female teenagers are more likely than male teenagers to think it is almost certain they will be married in ten years. (c) Female teenagers are less likely than male teenagers to think it is almost certain they will be married in ten years. (d) There is no association between the number of female teens who responded “almost certain” and the number of male teens who feel this way. (e) There is an association between the number of female teens who responded “almost certain” and the number of male teens who feel this way. 9. Software gives the chi-square statistic as X2 = 69.8 for this table. The P-value is (a) between 0.0025 and 0.001. (b) between 0.001 and 0.0005. (c) less than 0.0005. (d) between 0.005 and 0.001. (e) between 0.01 and 0.001. 10. The most important fact that allows us to trust the results of the chi-square test is (a) the sample is large, 4877 teenagers in all. (b) the sample is close to an SRS of all teenagers. (c) all of the cell counts are greater than 100. (d) the P-value is very small. (e) the X2 test statistic is very large. Chapter 14 10 Test 14B Part 2: Free Response Answer completely, but be concise. Write sequentially and show all steps. 11. Births are not evenly distributed across the days of the week. Fewer babies are born on Saturday and Sunday than on other days, probably because doctors find weekend births inconvenient. A random sample of 700 births from local records shows this distribution across the days of the week: Day Births Sun. 84 Mon. 110 Tue. 124 Wed. 104 Thu. 94 Fri. 112 Sat. 72 (a) The null hypothesis is that all days are equally probable. What are the probabilities specified by this null hypothesis? (b) What are the expected counts for each day in 700 births? (c) Calculate the chi-square statistic for goodness of fit. (d) What are the degrees of freedom for this statistic? (e) Do 700 births give significant evidence that births are not equally probable on all days of the week? Chapter 14 11 Test 14B 12. A sample survey by the Pew Internet and American Life Project asked a random sample of adults about use of the Internet and about the type of community they lived in. Here are the results: Internet users Nonusers Rural 433 463 Community Type Suburban 1072 627 Urban 536 388 Is there a relationship between Internet use and community type? Give statistical evidence to support your findings. I pledge that I have neither given nor received aid on this test.__________________________________________ Chapter 14 12 Test 14B


