Exam 3 Information (Word)
advertisement
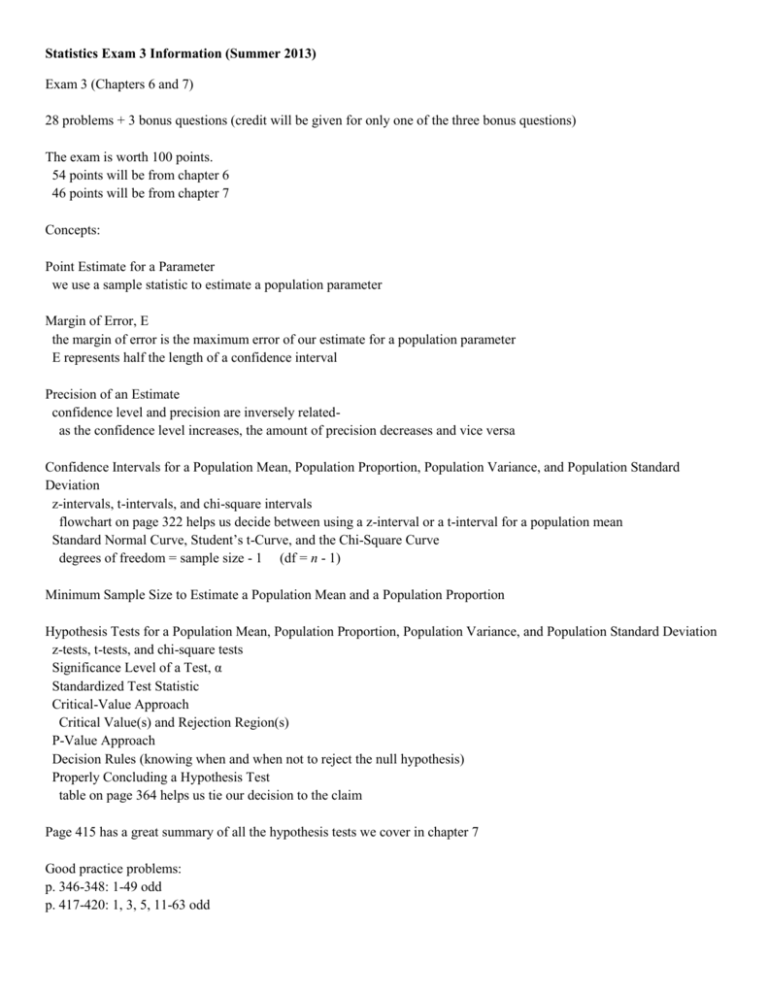
Statistics Exam 3 Information (Summer 2013) Exam 3 (Chapters 6 and 7) 28 problems + 3 bonus questions (credit will be given for only one of the three bonus questions) The exam is worth 100 points. 54 points will be from chapter 6 46 points will be from chapter 7 Concepts: Point Estimate for a Parameter we use a sample statistic to estimate a population parameter Margin of Error, E the margin of error is the maximum error of our estimate for a population parameter E represents half the length of a confidence interval Precision of an Estimate confidence level and precision are inversely relatedas the confidence level increases, the amount of precision decreases and vice versa Confidence Intervals for a Population Mean, Population Proportion, Population Variance, and Population Standard Deviation z-intervals, t-intervals, and chi-square intervals flowchart on page 322 helps us decide between using a z-interval or a t-interval for a population mean Standard Normal Curve, Student’s t-Curve, and the Chi-Square Curve degrees of freedom = sample size - 1 (df = n - 1) Minimum Sample Size to Estimate a Population Mean and a Population Proportion Hypothesis Tests for a Population Mean, Population Proportion, Population Variance, and Population Standard Deviation z-tests, t-tests, and chi-square tests Significance Level of a Test, α Standardized Test Statistic Critical-Value Approach Critical Value(s) and Rejection Region(s) P-Value Approach Decision Rules (knowing when and when not to reject the null hypothesis) Properly Concluding a Hypothesis Test table on page 364 helps us tie our decision to the claim Page 415 has a great summary of all the hypothesis tests we cover in chapter 7 Good practice problems: p. 346-348: 1-49 odd p. 417-420: 1, 3, 5, 11-63 odd

