6.1 COMBINED CONSUMER PRICE INDEX NUMBERS
advertisement
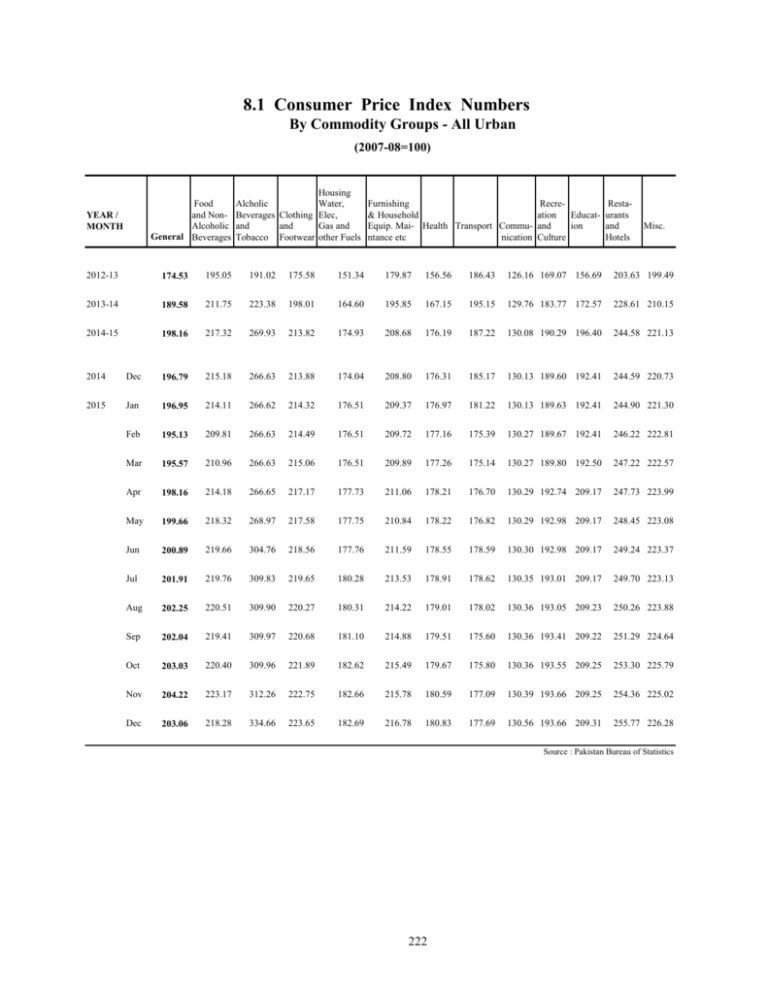
8.1 Consumer Price Index Numbers By Commodity Groups - All Urban (2007-08=100) Food and NonAlcoholic General Beverages YEAR / MONTH Housing Alcholic Water, Beverages Clothing Elec, and and Gas and Tobacco Footwear other Fuels Furnishing & Household Equip. Mai- Health Transport Communtance etc nication RecreRestaation Educat- urants and ion and Culture Hotels Misc. 2012-13 174.53 195.05 191.02 175.58 151.34 179.87 156.56 186.43 126.16 169.07 156.69 203.63 199.49 2013-14 189.58 211.75 223.38 198.01 164.60 195.85 167.15 195.15 129.76 183.77 172.57 228.61 210.15 2014-15 198.16 217.32 269.93 213.82 174.93 208.68 176.19 187.22 130.08 190.29 196.40 244.58 221.13 2014 Dec 196.79 215.18 266.63 213.88 174.04 208.80 176.31 185.17 130.13 189.60 192.41 244.59 220.73 2015 Jan 196.95 214.11 266.62 214.32 176.51 209.37 176.97 181.22 130.13 189.63 192.41 244.90 221.30 Feb 195.13 209.81 266.63 214.49 176.51 209.72 177.16 175.39 130.27 189.67 192.41 246.22 222.81 Mar 195.57 210.96 266.63 215.06 176.51 209.89 177.26 175.14 130.27 189.80 192.50 247.22 222.57 Apr 198.16 214.18 266.65 217.17 177.73 211.06 178.21 176.70 130.29 192.74 209.17 247.73 223.99 May 199.66 218.32 268.97 217.58 177.75 210.84 178.22 176.82 130.29 192.98 209.17 248.45 223.08 Jun 200.89 219.66 304.76 218.56 177.76 211.59 178.55 178.59 130.30 192.98 209.17 249.24 223.37 Jul 201.91 219.76 309.83 219.65 180.28 213.53 178.91 178.62 130.35 193.01 209.17 249.70 223.13 Aug 202.25 220.51 309.90 220.27 180.31 214.22 179.01 178.02 130.36 193.05 209.23 250.26 223.88 Sep 202.04 219.41 309.97 220.68 181.10 214.88 179.51 175.60 130.36 193.41 209.22 251.29 224.64 Oct 203.03 220.40 309.96 221.89 182.62 215.49 179.67 175.80 130.36 193.55 209.25 253.30 225.79 Nov 204.22 223.17 312.26 222.75 182.66 215.78 180.59 177.09 130.39 193.66 209.25 254.36 225.02 Dec 203.06 218.28 334.66 223.65 182.69 216.78 180.83 177.69 130.56 193.66 209.31 255.77 226.28 Source : Pakistan Bureau of Statistics 222 Index Numbers of Consumer Prices (2007- 08=100) Annual 250 189.6 200 198.2 174.5 Index Numbers 162.6 150 146.5 100 50 0 2010-11 2011-12 2012-13 2013-14 2014-15 Monthly 206 204 Index Numbers 202 200 198 196 194 192 190 Dec Jan Feb Mar Apr May Jun Jul Aug Sep Oct Nov Dec Index 196.8 197.0 195.1 195.6 198.2 199.7 200.9 201.9 202.3 202.0 203.0 204.2 203.1 Numbers 2014 2015 223 Index Numbers of Wholesale Prices (2007- 08=100) Annual 250 210.5 209.9 200 Index Numbers 164.2 194.6 181.3 150 100 50 0 2010-11 2011-12 2012-13 2013-14 2014-15 Monthly 218 216 Index Numbers 214 212 210 208 206 204 202 200 Dec Jan Feb Mar Apr May Jun Jul Aug Sep Oct Nov Dec Index Numbers 208.3 206.1 203.9 203.9 205.7 207.9 210.4 209.6 208.4 207.6 208.7 208.7 207.4 2014 2015 224 8.2 Index Numbers of Wholesale Prices by Commodity Groups (2007-08=100 ) YEAR / MONTH General Agriculture Forestry & Fishery Products Ores & Minerals, Electricity Gas & Water Food Products, Beverages and Tobacco, Textiles, Apparel and Leather Products Other Transportable Goods except Metal Products, Machinery and Equipments Metal Products Machinery & Equipments 2012-13 194.61 198.23 211.17 188.39 203.93 159.29 2013-14 210.48 219.00 240.37 200.70 214.59 168.31 2014-15 209.85 220.56 245.47 206.76 197.12 172.72 2014 Dec 208.25 213.09 247.20 205.77 199.17 172.37 2015 Jan 206.11 214.90 248.30 204.71 187.85 173.68 Feb 203.86 212.19 246.75 205.53 180.79 173.23 Mar 203.89 212.84 246.08 205.27 180.97 173.00 Apr 205.65 219.00 245.66 205.98 181.06 172.88 May 207.92 224.47 245.36 206.76 184.03 172.74 Jun 210.37 227.46 245.32 209.87 187.23 172.71 Jul 209.58 224.93 245.36 210.44 185.86 172.56 Aug 208.42 225.90 244.06 210.52 180.27 172.29 Sep 207.60 223.92 249.12 210.64 176.38 171.25 Oct 208.69 228.36 246.91 211.04 176.74 171.31 Nov 208.72 226.06 246.98 212.98 176.87 171.09 Dec 207.37 221.68 247.36 213.69 174.69 171.11 Source : Pakistan Bureau of Statistics 225 8.3 Sensitive Price Indicator (SPI) by Income Groups (2007-08 =100) INCOME GROUP YEAR / MONTH Group-I Up to Rs.8,000 Group-II Rs.8,001 to Rs.12,000 Group-III Rs.12,001 to Rs.18,000 Group-IV Rs.18,001 to Rs.35,000 Group-V Combined Above Rs.35,000 2012-13 184.04 190.32 189.09 190.42 190.82 189.64 2013-14 201.15 206.95 208.94 210.70 209.74 208.66 2014-15 204.66 210.75 213.79 215.40 212.95 212.61 2014 Dec 203.70 209.85 213.06 214.64 212.03 211.76 2015 Jan 201.92 208.09 211.30 212.83 210.03 209.89 Feb 199.92 205.79 208.78 209.92 206.59 206.98 Mar 199.92 205.81 208.83 209.99 206.70 207.05 Apr 200.70 206.77 209.95 211.37 208.40 208.42 May 203.33 209.62 212.99 214.56 211.53 211.48 Jun 205.34 211.83 215.43 217.37 214.82 214.29 Jul 206.04 212.55 216.19 218.21 215.76 215.13 Aug 205.65 211.92 215.53 217.42 214.77 214.33 Sep 206.58 213.25 215.45 219.00 215.80 215.23 Oct 209.02 216.02 216.72 220.94 217.31 217.02 Nov 211.11 218.16 218.97 223.31 219.81 219.37 Dec 209.62 216.87 217.86 222.48 219.50 218.60 Note: SPI figures revised as it is computed on 53 items instead of 51 items. 226 Source : Pakistan Bureau of Statistics 8.4 Bullion Prices (Rupees per 10 Grams) Karachi YEAR / MONTH GOLD TEZABI SILVER TEZABI 2010-11 37,658 776 2011-12 48,444 937 2012-13 50,744 888 2013-14 45,102 689 2014-15 40,818 600 2014 Dec 40,291 596 2015 Jan 41,264 601 Feb 41,291 592 Mar 40,292 576 Apr 40,432 572 May 40,050 565 Jun 39,668 550 Jul 38,556 537 Aug 38,928 545 Sep 38,965 549 Oct 39,977 589 Nov 38,944 575 Dec 38,030 560 Figures are monthly / yearly averages Source: Daily Dawn/Business Recorder 227
