Climate Graph Instructions
advertisement
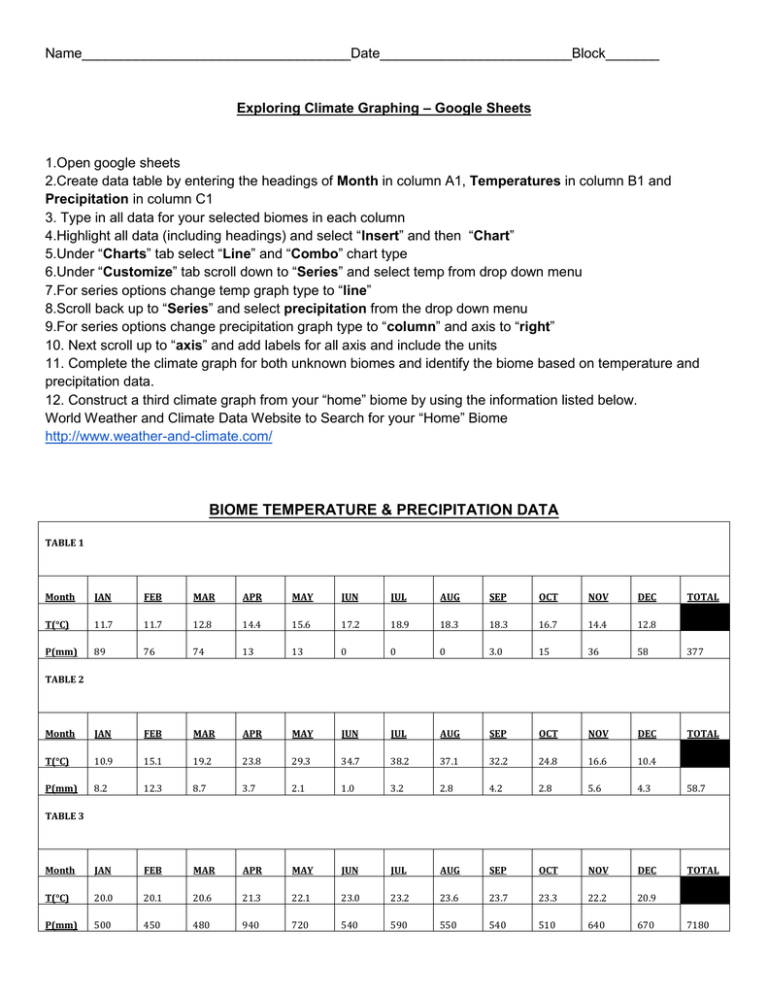
Name___________________________________Date_________________________Block_______ Exploring Climate Graphing – Google Sheets 1.Open google sheets 2.Create data table by entering the headings of Month in column A1, Temperatures in column B1 and Precipitation in column C1 3. Type in all data for your selected biomes in each column 4.Highlight all data (including headings) and select “Insert” and then “Chart” 5.Under “Charts” tab select “Line” and “Combo” chart type 6.Under “Customize” tab scroll down to “Series” and select temp from drop down menu 7.For series options change temp graph type to “line” 8.Scroll back up to “Series” and select precipitation from the drop down menu 9.For series options change precipitation graph type to “column” and axis to “right” 10. Next scroll up to “axis” and add labels for all axis and include the units 11. Complete the climate graph for both unknown biomes and identify the biome based on temperature and precipitation data. 12. Construct a third climate graph from your “home” biome by using the information listed below. World Weather and Climate Data Website to Search for your “Home” Biome http://www.weather-and-climate.com/ BIOME TEMPERATURE & PRECIPITATION DATA TABLE 1 Month JAN FEB MAR APR MAY JUN JUL AUG SEP OCT NOV DEC TOTAL T(°C) 11.7 11.7 12.8 14.4 15.6 17.2 18.9 18.3 18.3 16.7 14.4 12.8 P(mm) 89 76 74 13 13 0 0 0 3.0 15 36 58 377 Month JAN FEB MAR APR MAY JUN JUL AUG SEP OCT NOV DEC TOTAL T(°C) 10.9 15.1 19.2 23.8 29.3 34.7 38.2 37.1 32.2 24.8 16.6 10.4 P(mm) 8.2 12.3 8.7 3.7 2.1 1.0 3.2 2.8 4.2 2.8 5.6 4.3 58.7 Month JAN FEB MAR APR MAY JUN JUL AUG SEP OCT NOV DEC TOTAL T(°C) 20.0 20.1 20.6 21.3 22.1 23.0 23.2 23.6 23.7 23.3 22.2 20.9 P(mm) 500 450 480 940 720 540 590 550 540 510 640 670 TABLE 2 TABLE 3 7180 TABLE 4 Month JAN FEB MAR APR MAY JUN JUL AUG SEP OCT NOV DEC TOTAL T(°C) 3.5 4.6 8.9 14.4 19.2 23.4 25.0 24.4 21.1 14.7 9.0 4.4 P(mm) 85 84 95 79 91 96 117 108 93 76 68 84 1076 Month JAN FEB MAR APR MAY JUN JUL AUG SEP OCT NOV DEC TOTAL T(°C) -21.1 -18.1 -10.4 -1.0 8.5 14.6 16.1 13.2 7.0 -4.0 -15.3 -19.7 P(mm) 15 13 10 07 17 45 56 53 32 22 19 21 310 Month JAN FEB MAR APR MAY JUN JUL AUG SEP OCT NOV DEC TOTAL T(°C) -13.3 -10.5 -3.5 6.0 12.4 17.5 21.0 19.9 13.7 7.0 -2.5 -9.5 P(mm) 14 11 18 29 47 77 52 38 29 20 14 14 363 Month JAN FEB MAR APR MAY JUN JUL AUG SEP OCT NOV DEC TOTAL T(°C) 23.2 23.2 22.2 21.2 19.8 18.4 17.9 18.4 19.8 21.4 22.0 22.4 P(mm) 36 61 92 401 302 51 51 25 20 30 81 64 1214 Month JAN FEB MAR APR MAY JUN JUL AUG SEP OCT NOV DEC TOTAL T(°C) -25.2 -27.6 -26.1 -19.0 -7.0 1.1 4 3.2 -0.8 -10.2 -18.7 -24.0 P(mm) 4.5 3.8 3.6 4.4 3.7 8.2 22 25 16 12 6.2 4.1 113 MAR APR MAY JUN JUL AUG SEP OCT NOV DEC TOTAL Table 5 TABLE 6 TABLE 7 TABLE 8 TABLE 9 – Home Biome: Month T(°C) P(mm) JAN FEB Answer Key TABLE 1 ( CHAPARRAL- SANTA MONICA, CALIF. ) TABLE 2 ( MID-LATITUDE HOT & DRY DESERT – DEATH VALLEY,CALIFORNIA) TABLE 3 (TROPICAL RAINFOREST- MT. WAIALEALE,KAUAI, HAWAII) TABLE 5 (TAIGA, INTERIOR BASIN- FAIRBANKS, ALASKA) TABLE 4 (TEMPERATE DECIDUOUS FOREST- GREENSBORO,N.C.) TABLE 6 (TEMPERATE GRASSLANDS/PRAIRIE- WILLISTON, NORTH DAKOTA) TABLE 7 ( SAVANNA- MOSHI, TANZANIA ) TABLE 8 ( TUNDRA- BARROW,ALASKA)

