World Population – Including Historical Estimates
advertisement
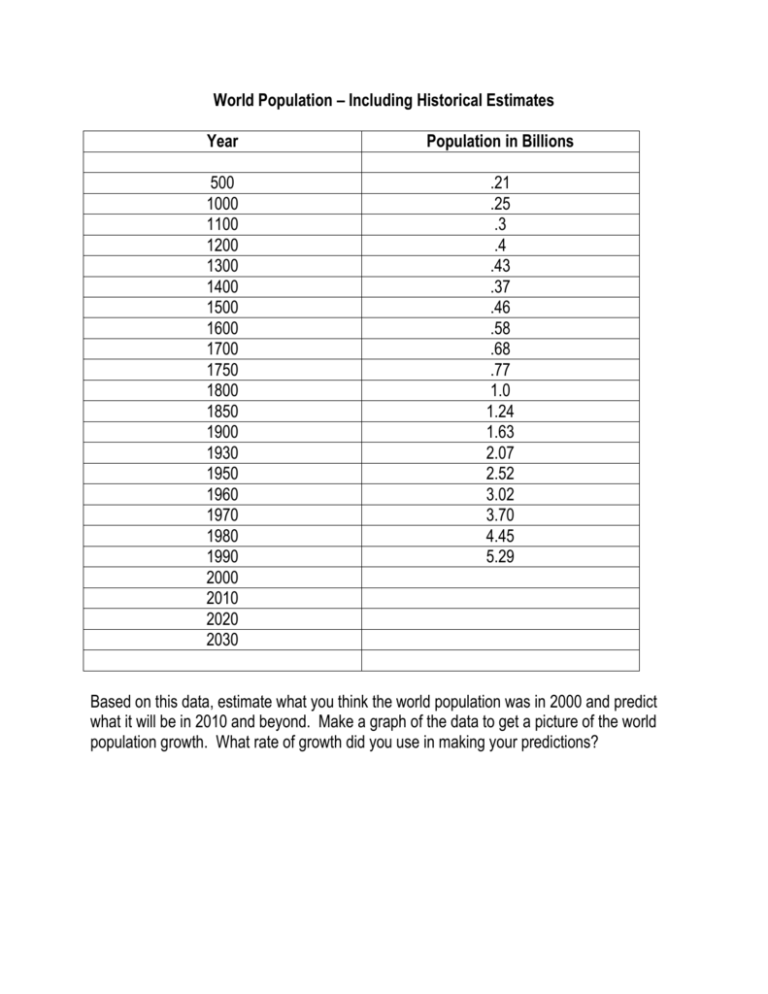
World Population – Including Historical Estimates Year Population in Billions 500 1000 1100 1200 1300 1400 1500 1600 1700 1750 1800 1850 1900 1930 1950 1960 1970 1980 1990 2000 2010 2020 2030 .21 .25 .3 .4 .43 .37 .46 .58 .68 .77 1.0 1.24 1.63 2.07 2.52 3.02 3.70 4.45 5.29 Based on this data, estimate what you think the world population was in 2000 and predict what it will be in 2010 and beyond. Make a graph of the data to get a picture of the world population growth. What rate of growth did you use in making your predictions? Visit To My Friend’s Farm 1 2 3 4 5 6 7 Number of Cats 3 9 27 81 n Visit Home 0 1 2 3 4 5 6 7 n Number of Dogs 3 5 11 29 83 n 0 1 2 3 4 5 6 f(n) 1 2 4 8 16 n n 0 1 2 3 4 5 6 n f(n) 0 2 4 6 Population to the Nearest Million Year Argentina Kenya U.S.A. 1950 17 6 152 1990 32 16 250 Which of the three countries in the table grew the most? Which of the three countries in the table grew the fastest? Explain your reasoning in each case.
