PPadua-Douglas,E. HMWK 2012-09-12 12763-1
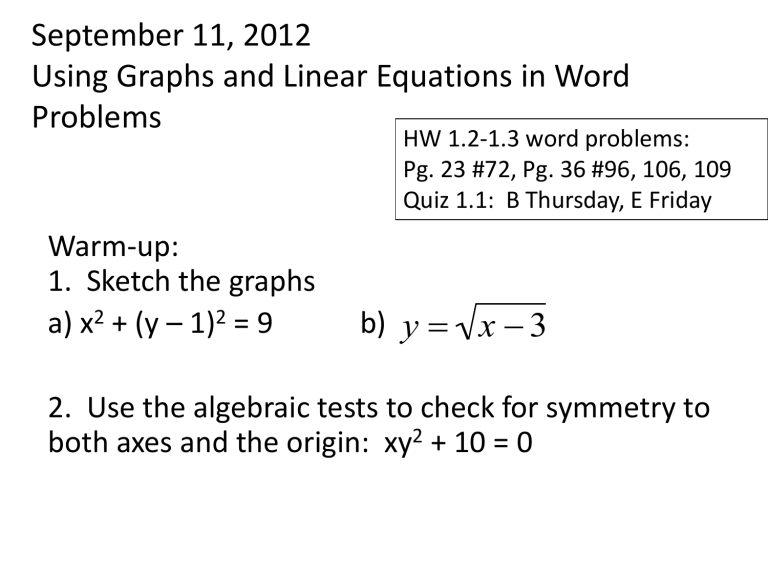
September 11, 2012
Using Graphs and Linear Equations in Word
Problems
HW 1.2-1.3 word problems:
Pg. 23 #72, Pg. 36 #96, 106, 109
Quiz 1.1: B Thursday, E Friday
Warm-up:
1. Sketch the graphs a) x 2 + (y – 1) 2 = 9 b) y x 3
2. Use the algebraic tests to check for symmetry to both axes and the origin: xy 2 + 10 = 0
Check HW 1.2
Using graphs and linear equations to solve word problems.
Depreciation:
A manufacturing plant purchases a new molding machine for $225,000. the depreciated value y
(reduced value) after t years is given by
y = 225,000 – 20,000t, 0 ≤ t ≤ 6. Sketch the graph of the equation.
Using Slope in Word Problems
The graph shows the average salaries for high school principals from 1990 through 2002.
a) Use the slopes to determine the time periods in which the average salary increased the greatest and the least.
b) Find the slope of the line segment connecting the years 1990 and 2002. c) Interpret the meaning of the slope in part (b) in the context of the problem.
Using rate of change
The cash flow per share for the Timberland Co. was $0.18 in 1995 and $4.04 in 2003. Write a linear equation that gives the cash flow per share in terms of the year. Let t = 5 represent
1995. Then predict the cash flows for the years 2008 and 2010.

