Unit II Additional Practice - Graphs and Motion Maps For
advertisement
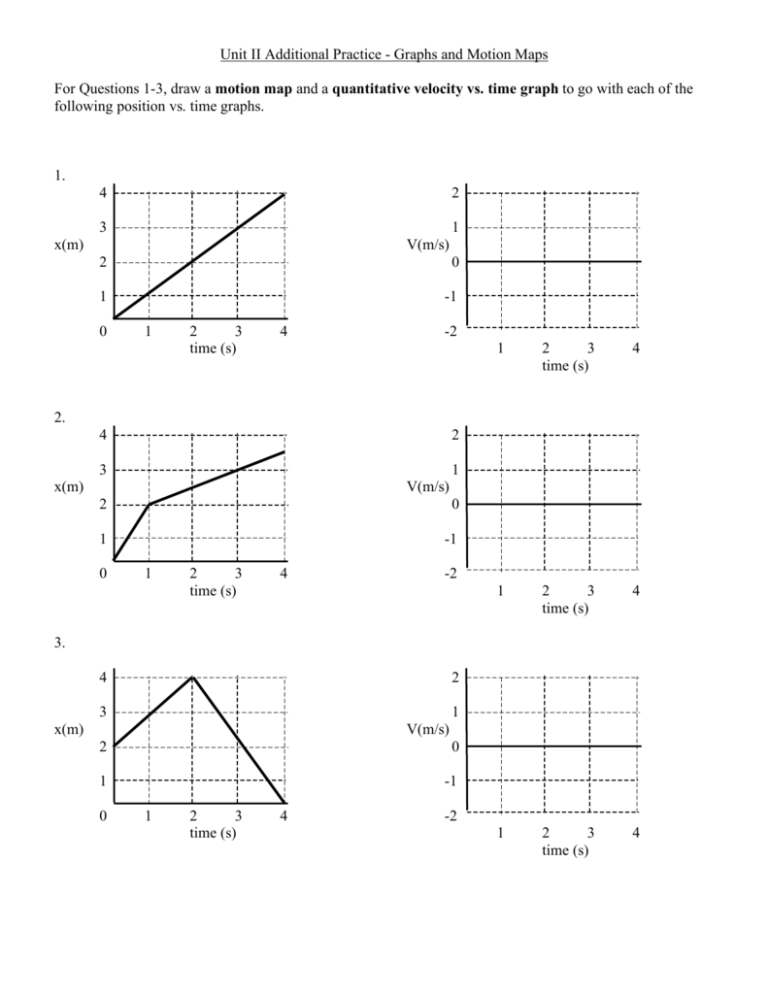
Unit II Additional Practice - Graphs and Motion Maps For Questions 1-3, draw a motion map and a quantitative velocity vs. time graph to go with each of the following position vs. time graphs. 1. 4 2 3 1 x(m) V(m/s) 2 0 1 -1 0 1 2 3 time (s) 4 -2 1 2 3 time (s) 4 1 2 3 time (s) 4 1 2 3 time (s) 4 2. 4 2 3 1 x(m) V(m/s) 2 0 1 -1 0 1 2 3 time (s) 4 -2 3. 4 2 3 1 x(m) V(m/s) 2 0 1 -1 0 1 2 3 time (s) 4 -2 Sketch a position vs. time graph, a velocity vs. time graph and a motion map corresponding to each of the following descriptions of the motion of an object. 4. The object is moving away from its original position (the x=0 position) at a constant speed. 5. The object is standing still. 6. The object moves toward the X=0 position at a steady speed for 5 seconds, and then stands still for 5 seconds. 7. The object moves away from the X=0 position at a steady speed for 5 seconds, changes direction, and moves back toward the origin at the same speed.
