Traffic Descriptions
advertisement
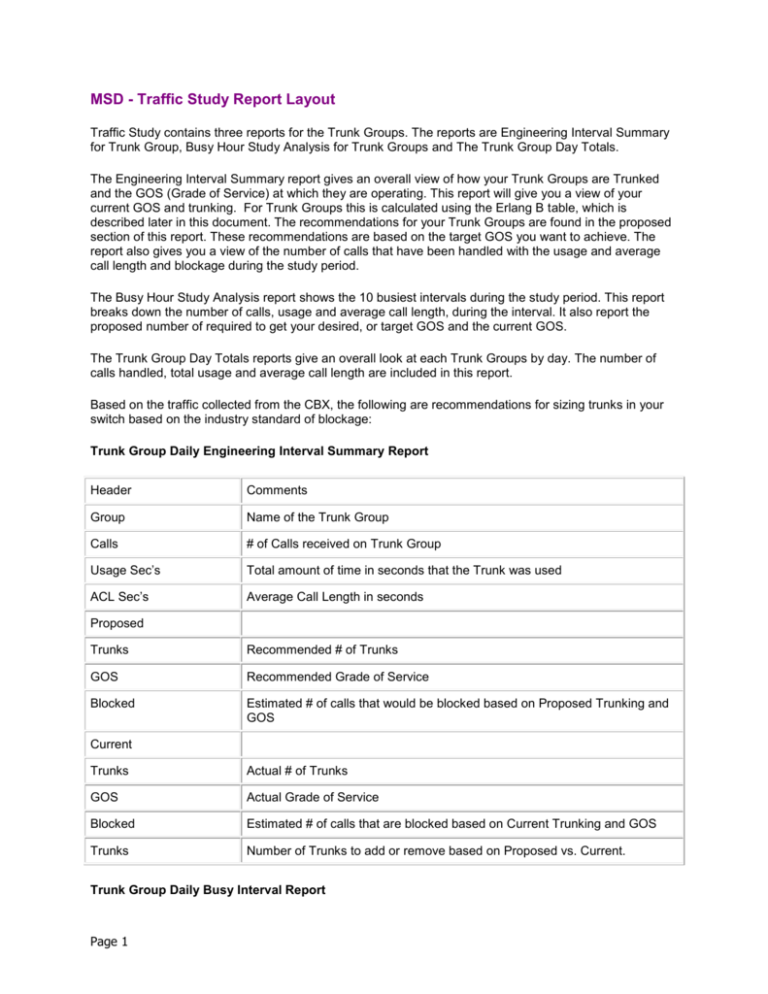
MSD - Traffic Study Report Layout Traffic Study contains three reports for the Trunk Groups. The reports are Engineering Interval Summary for Trunk Group, Busy Hour Study Analysis for Trunk Groups and The Trunk Group Day Totals. The Engineering Interval Summary report gives an overall view of how your Trunk Groups are Trunked and the GOS (Grade of Service) at which they are operating. This report will give you a view of your current GOS and trunking. For Trunk Groups this is calculated using the Erlang B table, which is described later in this document. The recommendations for your Trunk Groups are found in the proposed section of this report. These recommendations are based on the target GOS you want to achieve. The report also gives you a view of the number of calls that have been handled with the usage and average call length and blockage during the study period. The Busy Hour Study Analysis report shows the 10 busiest intervals during the study period. This report breaks down the number of calls, usage and average call length, during the interval. It also report the proposed number of required to get your desired, or target GOS and the current GOS. The Trunk Group Day Totals reports give an overall look at each Trunk Groups by day. The number of calls handled, total usage and average call length are included in this report. Based on the traffic collected from the CBX, the following are recommendations for sizing trunks in your switch based on the industry standard of blockage: Trunk Group Daily Engineering Interval Summary Report Header Comments Group Name of the Trunk Group Calls # of Calls received on Trunk Group Usage Sec’s Total amount of time in seconds that the Trunk was used ACL Sec’s Average Call Length in seconds Proposed Trunks Recommended # of Trunks GOS Recommended Grade of Service Blocked Estimated # of calls that would be blocked based on Proposed Trunking and GOS Current Trunks Actual # of Trunks GOS Actual Grade of Service Blocked Estimated # of calls that are blocked based on Current Trunking and GOS Trunks Number of Trunks to add or remove based on Proposed vs. Current. Trunk Group Daily Busy Interval Report Page 1 Header Comments Date Date of Activity Time Busy Hour Recorded Day Day of the Activity Rank Where that particular Busy Hour ranks in conjunction with other busy hours for that day. Handled Calls # of calls handled for that busy hour Usage Sec’s Amount of time in seconds used in that busy hour ACL Sec’s Average Call Length in seconds for that busy hour Proposed Trunks Recommended # of Trunks Blocked Estimated # of calls that would be blocked based on Proposed Trunking Current Trunks Actual # of Trunks Blocked Estimated # of calls that are blocked based on Current Trunking +/- Number of Trunks to add or remove based on Proposed vs. Current. Trunks Remove/Add Number of Trunks to add or remove based on Proposed vs. Current. Trunk Group Day Totals Header Comments Trunk Group Name Name of Trunk Group Number Number of Trunk Group assigned by the switch # of Trunks # of Trunk for that Trunk Group Call Volumes Completed Incoming # of incoming calls answered Outgoing # of outgoing calls made Calls Blocked Number Page 2 Estimated # of calls blocked % Estimated % of calls blocked Total Attempts (Completed Incoming + Outgoing + # of Calls Blocked) Totals Usage Sec’s Amount of time in seconds that the trunk was used Average Call Length In Average incoming call length in seconds Out Average outgoing call length in seconds Total Total Average Call Length using Incoming and Outgoing All Trunks Busy # of second all trunks were busy Traffic Engineering Primer Overview Definition of Traffic The term traffic is used to describe the method of counting the number of calls and their duration for the purpose of sizing the number of facilities needed, and to provide a certain level of service to carry a given number of hours of traffic. Traffic measurements are used to determine the carrying capacity of our switch when all traffic and functions are at their greatest demand. Traffic can be measured by multiplying the number of calls within a specific time period by the average length of calls. The following formula is an example of this process: C x A = T C A number of calls in a given period. Let’s say 50 calls. A The average call length. Let’s say 3 minutes. T The amount of traffic 50 calls x 3 minute average call length = 150 minutes of traffic 150 minutes divided by 60 (minutes/hour) = 2.5 hours of traffic What is Traffic Analysis? Traffic Analysis is the study of three (3) CBX system characteristics: 1. Page 3 Statistics including: number of times all trunks were busy in one day, number of calls that were placed over a trunk in one day, time of day the CBX placed the most calls, many other telephone traffic patterns. Page 4 2. Facilities including: trunks, attendant consoles 3. Grade of Service including: portion of calls that are allowed to reach a busy tone during a study period applies to groups of facilities. What is the Purpose of Traffic Engineering? The attempt to balance performance with economics, to achieve the greatest utilization of facilities while maintaining the cost at a level that is beneficial to the user. "The art and science determining the minimum quantities of equipment and trunks which will carry the required traffic with an acceptable grade-of-service". Emerson C. Smith, Glossary of Communication. Traffic Measurement Units of Measurement 1. Traffic is measured in number of hours of usage. Better expressed as how many hours of traffic are offered in one hour of time over a single facility. Logic tells us that a maximum of one hour of traffic can be carried in a one hour time period. 2. In engineering, one hour of traffic in a one-hour time frame is called an Erlang. It was so named after the mathematician who created many modern traffic theories. a. Erlangs relate traffic to the number of circuits in an system and the utilization of those circuits. b. Therefore: 1 Hour of Traffic = 1 Erlang 3. The next most commonly used traffic measurement is CCS or Centum Call Seconds. This method of measurement, which is defined as 100 seconds, is used in expanded traffic statistics. Many of the industry standards charts and tables are written in CCS per line. a. 60 seconds x 60 minutes = 3600 seconds in 1 Hour b. 1 CCS = 100 seconds, in order to determine how many CCS are in 1 hour (1 Erlang), divide 3600 seconds by 100 = 36 CCS. c. Therefore: 1 Hour = 36 CCS d. Should we have need to convert CCS to minutes, the same principals apply: Remembering to keep seconds as the common denominator: 1 CCS = 100 seconds 1 min. = 60 seconds 100 seconds divided by 60 seconds (in a minute) = 1.67 minutes Page 5 e. Therefore: 1 CCS = 1.67 Minutes or 100 Seconds Page 6 4. Examples of source data: Depending upon where we acquire our traffic information and data, it becomes necessary to convert from one method of measurement into another in order to engineer the most accurate design. Expanded traffic Statistics AT&T standards tables, Request For Proposal..............................CCS Traffic Theory Erlang B charts Erlang C charts, etc. AT&T Offered Traffic Tables.................Erlangs Phone Bills SMDR/CDR......................................Minutes/Hours Understanding traffic measurements and the conversion methods is vital in performing engineering designs correctly. Units of Measure Conversion Chart CCS CCS 1 CCS 1 CCS 36 CCS Erlangs 1 Erlang 1 Erlang 1 Erlang Minutes 1 Minute 1 Minute = = = = Centum Call Second 100 Seconds 1.67 Minutes 1 Hour or 1 Erlang = = = 36 CCS 60 Minutes 3600 Seconds = = 60 Seconds .6 CCS (60 sec./100 sec.) Traffic Theories Background Mathematicians develop traffic theories that predict how people will use their telephones. These theories give us a systematic approach to sizing facilities and switches. The tables and formulas that we use in traffic engineering are based on theories; on the probability that someone will pick up their phone and make a call. So the traffic predictions we make are not correct 100% of the time. The traffic theory used by Unify, and the industry in general, for trunk traffic analysis is Erlang B. Erlang B Page 7 Overview Developed by A. K. ERLANG who was working on a method called 'statistical equilibrium'. Erlang assumed that a trunk group might have any number of calls in progress at any given time. Assumptions Assumes that blocked calls are cleared, but will never be offered to that trunk group again. If a call finds all trunks busy, it either hangs up or is routed to another trunk group. From the standpoint of that particular trunk group, the call is cleared. This caller may hang-up and re-call but is seen then as a new call being offered to this trunk group. Retrys are not part of the Erlang B theory. This theory may sound familiar to you, it is in fact, the principal behind Route Optimization without Queuing. In Route Optimization, a call is received and if the facility is busy that call is overflowed to the next trunk group. Page 8 Depending on blockage, offered and carried traffic can differ significantly. Erlang B Carried Traffic Capacity Tables No. of Trunks 1 2 3 4 5 6 7 8 9 10 11 12 13 14 15 16 17 18 19 20 21 22 23 24 25 26 27 28 29 30 31 32 33 34 35 36 37 38 39 40 41 42 Page 9 (c) Copyright ROLM Company 1979 10.00% 5.00% 2.00% 1.00% 0.50% 0.10% No. of Trunks B.10 B.05 B.02 B.01 B.005 B.001 0.10 0.05 0.02 0.01 0.01 0.00 1 0.54 0.36 0.22 0.15 0.10 0.05 2 1.14 0.85 0.59 0.45 0.35 0.19 3 1.84 1.45 1.07 0.86 0.70 0.44 4 2.59 2.11 1.62 1.35 1.13 0.76 5 3.38 2.81 2.23 1.89 1.61 1.14 6 4.20 3.55 2.88 2.48 2.15 1.58 7 5.04 4.32 3.55 3.10 2.72 2.05 8 5.89 5.10 4.26 3.74 3.32 2.55 9 6.76 5.91 4.98 4.42 3.94 3.09 10 7.64 6.72 5.72 5.11 4.59 3.65 11 8.53 7.55 6.48 5.82 5.25 4.23 12 9.42 8.39 7.25 6.54 5.93 4.83 13 10.33 9.24 8.04 7.28 6.63 5.44 14 11.24 10.1 8.83 8.03 7.34 6.07 15 12.15 10.97 9.63 8.79 8.06 6.71 16 13.07 11.84 10.44 9.56 8.79 7.37 17 13.99 12.72 11.26 10.33 9.53 8.04 18 14.92 13.60 12.09 11.12 10.28 8.72 19 15.86 14.49 12.92 11.91 11.04 9.40 20 16.79 15.38 13.76 12.71 11.80 10.10 21 17.72 16.28 14.6 13.51 12.57 10.80 22 18.66 17.18 15.45 14.32 13.35 11.51 23 19.61 18.08 16.30 15.14 14.13 12.23 24 20.55 18.99 17.15 15.96 14.92 12.96 25 21.50 19.90 18.02 16.79 15.72 13.69 26 22.45 20.81 18.88 17.62 16.52 14.42 27 23.40 21.72 19.75 18.45 17.32 15.17 28 24.35 22.64 20.62 19.29 18.13 15.91 29 25.30 23.56 21.49 20.13 18.94 16.67 30 26.26 24.48 22.37 20.98 19.75 17.42 31 27.21 25.41 23.25 21.83 20.57 18.19 32 28.17 26.33 24.13 22.68 21.40 18.95 33 29.13 27.26 25.02 23.54 22.22 19.72 34 30.09 28.19 25.91 24.39 23.05 20.50 35 31.05 29.12 26.80 25.25 23.89 21.27 36 32.02 30.06 27.69 26.12 24.72 22.06 37 32.98 30.99 28.58 26.98 25.56 22.84 38 33.94 31.93 29.48 27.85 26.40 23.63 39 34.91 32.86 30.38 28.72 27.24 24.42 40 35.88 33.80 31.28 29.59 28.09 25.21 41 36.84 34.74 32.18 30.46 28.94 26.01 42 43 44 45 46 47 48 49 50 37.81 38.78 39.75 40.72 41.69 42.66 43.63 44.61 35.68 36.63 37.57 38.52 39.46 40.41 41.36 42.31 33.08 33.99 34.89 35.80 36.71 37.62 38.54 39.45 31.34 32.22 33.10 33.98 34.86 35.75 36.63 37.52 29.79 30.64 31.50 32.35 33.21 34.08 34.94 35.80 26.81 27.61 28.42 29.23 30.04 30.85 31.66 32.48 43 44 45 46 47 48 49 50 Erlang B Carried Traffic Capacity Tables (c) Copyright ROLM Company 1979 No. of 10.00% 5.00% 2.00% 1.00% 0.50% 0.10% No. of Trunks Trunks B.10 B.05 B.02 B.01 B.005 B.001 51 45.58 43.26 40.36 38.41 36.67 33.30 51 52 46.55 44.21 41.28 39.30 37.54 34.12 52 53 47.53 45.16 42.20 40.20 38.41 34.94 53 54 48.50 46.11 43.12 41.09 39.28 35.77 54 55 49.48 47.06 44.04 41.99 40.15 36.59 55 56 50.45 48.02 44.96 42.88 41.02 37.42 56 57 51.43 48.97 45.88 43.78 41.90 38.25 57 58 52.41 49.93 46.81 44.68 42.78 39.08 58 59 53.38 50.88 47.73 45.58 43.65 39.92 59 60 54.36 51.84 48.65 46.48 44.53 40.75 60 61 55.34 52.80 49.58 47.38 45.41 41.59 61 62 56.32 53.75 50.51 48.29 46.30 42.43 62 63 57.30 54.71 51.43 49.19 47.18 43.27 63 64 58.28 55.67 52.36 50.09 48.06 44.11 64 65 59.26 56.63 53.29 51.00 48.95 44.95 65 66 60.24 57.59 54.22 51.91 49.84 45.80 66 67 61.22 58.55 55.15 52.82 50.72 46.64 67 68 62.20 59.51 56.08 53.73 51.61 47.49 68 69 63.18 60.48 57.01 54.64 52.50 48.34 69 70 64.16 61.44 57.95 55.55 53.39 49.19 70 71 65.14 62.40 58.88 56.46 54.29 50.04 71 72 66.12 63.36 59.82 57.37 55.18 50.89 72 73 67.10 64.33 60.75 58.29 56.07 51.75 73 74 68.08 65.29 61.69 59.20 56.97 52.60 74 75 69.07 66.26 62.62 60.12 57.86 53.46 75 76 70.05 67.22 63.56 61.04 58.76 54.31 76 77 71.03 68.18 64.50 61.95 59.66 55.17 77 78 72.02 69.15 65.44 62.87 60.56 56.03 78 79 73.00 70.11 66.38 63.79 61.45 56.89 79 80 73.98 71.08 67.31 64.71 62.35 57.75 80 81 74.97 72.05 68.25 65.63 63.26 58.61 81 82 75.95 73.01 69.20 66.55 64.16 59.48 82 83 76.94 73.98 70.14 67.47 65.06 60.34 83 84 77.92 74.95 71.08 68.39 65.96 61.21 84 Page 10 85 86 87 88 89 90 91 92 93 94 95 96 97 98 99 100 Page 11 78.91 79.89 80.88 81.86 82.85 83.83 84.82 85.79 86.78 87.77 88.75 89.74 90.73 91.72 92.70 93.69 75.92 76.88 77.85 78.82 79.79 80.76 81.73 82.70 83.67 84.64 85.62 86.59 87.56 88.53 89.50 90.48 72.02 72.96 73.91 74.85 75.80 76.74 77.69 78.63 79.58 80.52 81.47 82.42 83.37 84.31 85.26 86.21 69.31 70.24 71.16 72.09 73.01 73.94 74.86 75.79 76.72 77.65 78.57 79.50 80.43 81.36 82.29 83.23 66.87 67.77 68.68 69.58 70.49 71.40 72.30 73.21 74.12 75.03 75.94 76.85 77.77 78.68 79.59 80.50 62.07 62.94 63.81 64.68 65.55 66.42 67.29 68.16 69.03 69.91 70.78 71.66 72.53 73.41 74.29 75.17 85 86 87 88 89 90 91 92 93 94 95 96 97 98 99 100 Trunk Group Efficiency Increasing Trunk Group Size Intuitively, we want to believe that if one trunk carries some amount of traffic, two trunks will carry twice as much--or that each trunk can carry the same amount of traffic. As the number of trunks increases, the amount of traffic each trunk can carry approaches one Erlang. The conclusion we can draw is that larger trunk groups are more efficient because there is a greater probability of finding a trunk that is available Example of "Larger Trunk Groups Are More Efficient" # of Trunks 40 20 10 Carried Traffic (1) 28.7 11.9 4.4 % Utilization (2) 71.75% 59.50% 44.40% Note: 1. Using Erlang B tables at B.01 2. Carried Traffic / # of Trunks Increased Blockage Increasing the blockage on a trunk group will also increase the efficiency of each trunk in the group. Example of Increasing the Blockage Traffic Carried 20 20 20 Blockage B.01 B.05 B.10 # Trunks Required 30 27 25 Glossary Busy Hour for Engineering The engineering method to be used for this trunk group. There are two choices: 1. Average busy hour: The mean value associated with the busy hour for each day of the traffic study. 2. Maximum busy hour: The busy hour during the study period with the highest traffic values. Grade of Service Page 12 A traffic engineering parameter expressing the probability of blockage in the busy hour. For example, a B.01 grade of service determines subsequent calculations based upon 1 call out of 100 being blocked during the Busy Hour as determined by an Erlang B traffic model. All of the blockage values listed in this study have been calculated using the standard traffic formula, ERLANG B. This formula is widely used and has been found to provide a high degree of accuracy. The blockage values listed represent the number of calls which would be blocked from a trunk group out of every one hundred calls attempted. With route optimization, a call that is blocked from one trunk group may be offered to another. Route optimization is a CBX feature that automatically selects the most economical route for an outgoing call based upon routing tables stored in memory. When no trunks are available in the selected route, the call may be offered to another route, thus making blockage on that trunk group transparent to the caller. For certain trunks (e.g. FX and WATS) a higher blockage is desirable. Unless specified by the customer, the following blockages are used to calculate the trunks required based on the traffic study: Central Office (CO) in, out, or bothway Inbound WATS (8000) Outbound WATS Foreign Exchange (FX) Tie Lines Direct Inward Dial (DID) B.01 B.01 B.05 B.10 B.10 B.01 Peg Count Increments of traffic values, such as how many incoming calls. A definition taken from: Telephony's Dictionary: Telecommunication Words and Terms by Graham Langley: “A count of seizure, or attempts at seizure, of telephone trunks, circuits, or switching equipment expressed as calls per hour per line or of calls handled by an operator during a specified time interval.” Analysis Fundamental data for traffic analysis: Number of trunks Page 13 Type of trunks Number of calls Busy hour Traffic patterns Blockage Utilization The number of hours of traffic (in hours or expressed as a percentage of the total possible hours of traffic) that a trunk group carried for that hour. For example, ten trunks can carry 10 hours of traffic if all trunks were busy for the whole hour. If the trunks carried 5 hours of traffic, they are utilized 50%. The Erlang B table is used to determine that maximum allowable utilization to support a particular blockage level. Page 14
