Probabilities and Data Representation REVIEW 2 Name: Draw a
advertisement
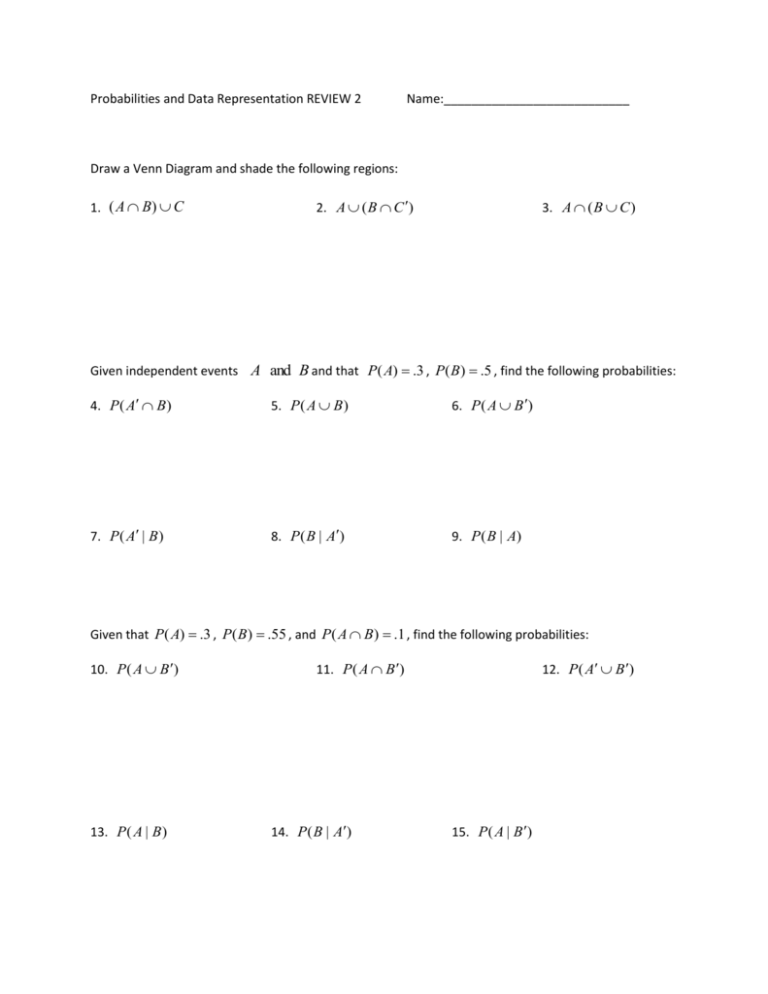
Probabilities and Data Representation REVIEW 2 Name:___________________________ Draw a Venn Diagram and shade the following regions: 1. ( A B) C 2. A ( B C ) 3. A ( B C ) Given independent events A and B and that P( A) .3 , P( B) .5 , find the following probabilities: 4. P ( A B ) 5. P ( A B ) 6. P ( A B ) 7. P ( A | B ) 8. P ( B | A) 9. P ( B | A) Given that P( A) .3 , P( B) .55 , and P( A B) .1 , find the following probabilities: 10. P ( A B ) 13. P ( A | B ) 11. P ( A B ) 14. P ( B | A) 12. P ( A B ) 15. P ( A | B ) 16. Below draw a tree diagram that displays the following probabilities. I have 3 draws from a bag of marbles without replacement. The bag contains 4 white marbles and 9 blue ones. 17. What is the probability that all three are the same color? 18. A computer company obtains 40% of its CPU chips from Rock Solid Chips, a company whose defect rate is .002. The rest of its CPU chips come from Bake It Happen whose defect rate is .04. Complete the tree diagram. D Rock Solid D’ D Bake It Happen D’ 19. Given that a CPU is defective, what is the probability that it came from Bake It Happen? For problems 20 and 21, find the mean, variance, and standard deviation. Furthermore, identify any outliers (if they exist). 20. The following are the weights, in pounds, of 20 members of the football team: 245, 189, 214, 155, 141, 195, 215, 188, 197, 223, 251, 300, 200, 152, 134, 192, 218, 185, 199, 220 21. The final exam scores for Algebra 3-4: 65, 85, 100, 34, 85, 92, 77, 68, 71, 98, 95, 82, 67, 100, 76, 49, 96, 98, 19, 91, 90, 79, 66, 73, 96, 97, 80 22. The data below are the height (in feet) and trunk diameters (in inches) of eight trees. Construct a scatter plot for the data, calculate the correlation coefficient, and make a conclusion about the type of correlation. Be sure to include a scale and label for both the x and y axis. Height, x 70 72 75 76 85 78 77 80 Trunk Diameter, y 8.3 10.5 11.0 11.4 12.9 14.0 16.3 18.0 23. The data below are the height (in feet) and trunk diameters (in inches) of eight trees. Find the equation of the regression line (LSRL) for the given data. Height, x 70 72 75 76 85 78 77 80 Trunk Diameter, y 8.3 10.5 11.0 11.4 12.9 14.0 16.3 18.0 LSRL ______________________________________________ 24. Using the data in problem 23 above, predict the trunk diameter if the tree is: a) 74 feet b) 81 feet c) 79 feet
