Student_WCFT_12_3
advertisement
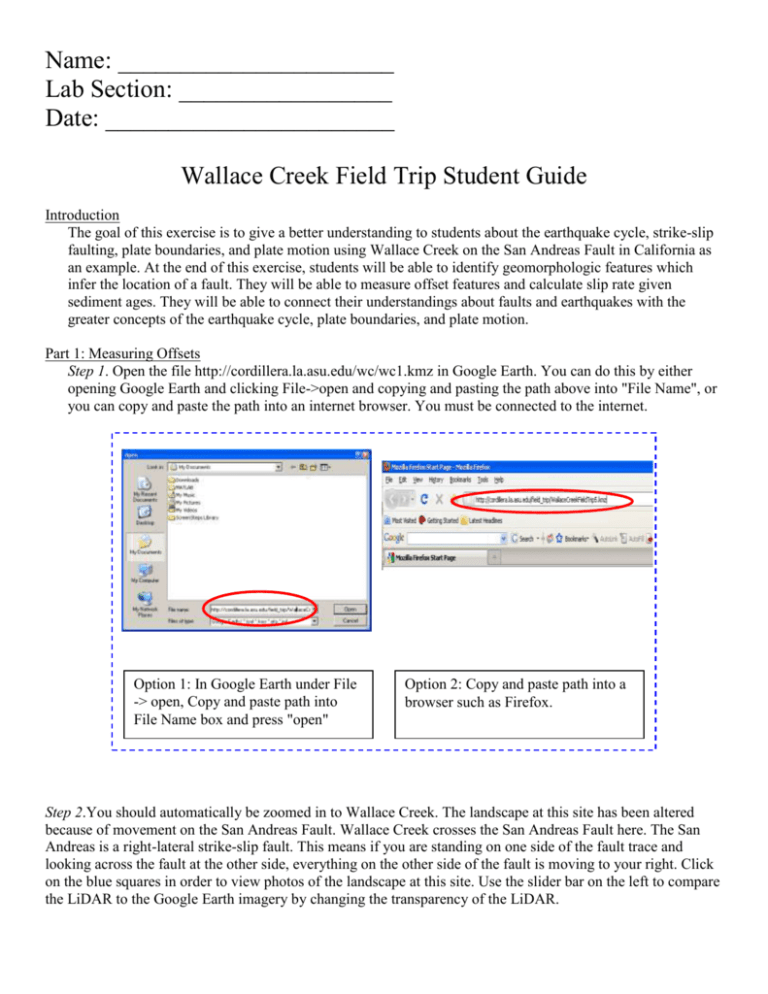
Name: ______________________ Lab Section: _________________ Date: _______________________ Wallace Creek Field Trip Student Guide Introduction The goal of this exercise is to give a better understanding to students about the earthquake cycle, strike-slip faulting, plate boundaries, and plate motion using Wallace Creek on the San Andreas Fault in California as an example. At the end of this exercise, students will be able to identify geomorphologic features which infer the location of a fault. They will be able to measure offset features and calculate slip rate given sediment ages. They will be able to connect their understandings about faults and earthquakes with the greater concepts of the earthquake cycle, plate boundaries, and plate motion. Part 1: Measuring Offsets Step 1. Open the file http://cordillera.la.asu.edu/wc/wc1.kmz in Google Earth. You can do this by either opening Google Earth and clicking File->open and copying and pasting the path above into "File Name", or you can copy and paste the path into an internet browser. You must be connected to the internet. Option 1: In Google Earth under File -> open, Copy and paste path into File Name box and press "open" Option 2: Copy and paste path into a browser such as Firefox. Step 2.You should automatically be zoomed in to Wallace Creek. The landscape at this site has been altered because of movement on the San Andreas Fault. Wallace Creek crosses the San Andreas Fault here. The San Andreas is a right-lateral strike-slip fault. This means if you are standing on one side of the fault trace and looking across the fault at the other side, everything on the other side of the fault is moving to your right. Click on the blue squares in order to view photos of the landscape at this site. Use the slider bar on the left to compare the LiDAR to the Google Earth imagery by changing the transparency of the LiDAR. 2.1 Describe the landscape here. Use the LiDAR hillshade, the satellite photography in Google Earth, and the ground photography to do this. What kind of environment is this? Describe any unusual features that you see. 2.2 How do you know that there is a fault here? Give at least two lines of evidence. Step 3. Click on the Add Path button. In the window that pops up, put the word "Fault". Then click out a line where you think the fault is. When you are finished, press ok. Add Path Button Example of fault line interpretation 3.1 Turn in your interpretation of where the fault is. One way to do this is to save a snapshot of the Google Earth window. Click on the Google Earth window, and press ctrl -> alt -> print screen. Then paste into Word (ctrl -> v). Step 4. Using the measuring tool in Google Earth, Measure the horizontal offset of Wallace Creek. Make sure you are measuring in meters. A critical part of this task is to think about how the offset markers project to the fault line you have mapped. Were they straight across and perpendicular when they formed but before offset? Or was there some natural variation in their mapped shape? Measure the offset a few times in different ways (middle to middle, bank to bank, etc...). 4.1 Record five measurements of displacement here, along with the average of your measurements. Offset amount in Short description of the feature that was offset. Is this a high or low confidence meters measurement? Average: 4.2 Researchers have determined via carbon dating that Wallace Creek channel is 3700 years old. What is the average rate of motion (slip rate) defined by the offset at Wallace Creek? (slip rate = displacement/time). Use the average of your displacement measurements from 4.1. Step 5: Look elsewhere along the fault for other offset channels (especially south of the main offset at Wallace Creek). 5.1 What is the smallest offset you encounter? Remember that the local smallest offset is attributed to the last ground-rupturing earthquake. Therefore, your answer should be how much offset you would attribute to the 1857 event. 5.2 How long will it take to build up the offset that occurred in 1857 based on the average rate of motion you calculated earlier? 5.3 Based on your calculation of how long it takes to build up the offset that occurred in 1857, when would you expect the next earthquake? 5.4 Based on your earthquake "forecast" date, should we be worried about earthquake preparedness? How does your answer compare to the answer of others? Compare your results with the results of others, and explain why you think your answer makes the most sense. Part 2: GPS Plate Motions Activity Wallace Creek Channel is just one of many offset features along the San Andreas Fault system in California. The San Andreas Fault is the most important part of the plate boundary where the Pacific Plate and North American Plate meet. Certain parts of the plate boundary are always moving (creeping) at the earth's surface with the rest of the plate. Other areas are stuck, such as the section of the San Andreas Fault where Wallace Creek is found. These sections only "break" once in a while, causing an earthquake. You just figured out how fast the two plates are moving relative to each other at a specific location along the plate boundary. The long-term slip rate is what you calculated using the geomorphology and paleoseismology at Wallace Creek. The current movement of plates can be determined by using Global Positioning System measurements of the movement of benchmarks, which tells us how much stress is building up along the San Andreas Fault waiting to be released in the next big ground-rupturing earthquake. The current strain rate on the San Andreas Fault can be calculated if we know how fast the plates are moving today relative to each other. Let us now calculate the rate of motion using GPS and compare it to the value you calculated in question 4.2 (Comparing the long-term slip rate with the current strain rate). For GPS velocities exercise: 6.1 For the parallel motion plot: Where is steepest gradient of motion? Why do you think it is there? 6.2 For the oblique motion plot: Where is the steepest gradient of motion? What kind of faults and earthquakes do you expect here? 6.3 Looking at the parallel motion plot, what is the velocity difference between the Sierra Nevadas and Lompoc? Compare this value with the value you obtained in question 4.2. If the answers are different, explain why they are different. If they are the same, explain why they are the same. What are these values telling us about the San Andreas Fault and about the relative motion of the Pacific and North American Plates? You can think of the strain buildup that is released in an earthquake as you snap your fingers: you hold them together and slowly load them up and then all the sudden snap. About this Activity: Authors: Sarah Robinson (Arizona State University) Ramon Arrowsmith (Arizona State University) Christopher Crosby (OpenTopography) Robert DeGroot (Southern California Earthquake Center)
