Practice #3. COLD WORK
advertisement
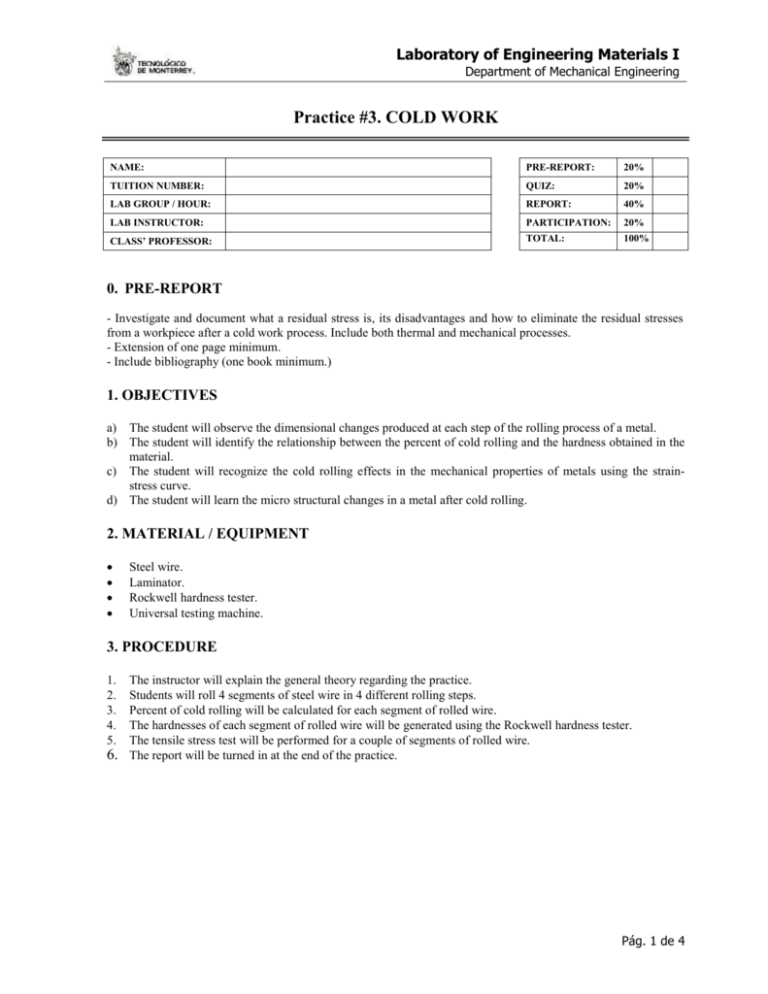
Laboratory of Engineering Materials I Department of Mechanical Engineering Practice #3. COLD WORK NAME: PRE-REPORT: 20% TUITION NUMBER: QUIZ: 20% LAB GROUP / HOUR: REPORT: 40% LAB INSTRUCTOR: PARTICIPATION: 20% CLASS’ PROFESSOR: TOTAL: 100% 0. PRE-REPORT - Investigate and document what a residual stress is, its disadvantages and how to eliminate the residual stresses from a workpiece after a cold work process. Include both thermal and mechanical processes. - Extension of one page minimum. - Include bibliography (one book minimum.) 1. OBJECTIVES a) The student will observe the dimensional changes produced at each step of the rolling process of a metal. b) The student will identify the relationship between the percent of cold rolling and the hardness obtained in the material. c) The student will recognize the cold rolling effects in the mechanical properties of metals using the strainstress curve. d) The student will learn the micro structural changes in a metal after cold rolling. 2. MATERIAL / EQUIPMENT Steel wire. Laminator. Rockwell hardness tester. Universal testing machine. 3. PROCEDURE 1. 2. 3. 4. 5. 6. The instructor will explain the general theory regarding the practice. Students will roll 4 segments of steel wire in 4 different rolling steps. Percent of cold rolling will be calculated for each segment of rolled wire. The hardnesses of each segment of rolled wire will be generated using the Rockwell hardness tester. The tensile stress test will be performed for a couple of segments of rolled wire. The report will be turned in at the end of the practice. Pág. 1 de 4 Laboratory of Engineering Materials I Department of Mechanical Engineering 4. REPORT 1. Complete the next table using the measurements and calculations done. (10pts) Analyzed piece L [cm] A [cm2] H [HR] %CW Without cold work Step 1 of cold work Step 2 of cold work Step 3 of cold work ---------------- Step 4 of cold work L Lenght Measure using either Vernier or tapeline Calculate per volume’s conservation A Transversal area H Hardness (Rockwell) An1 An Ln Ln1 Hardness test using the Rockwell hardness tester Calculate with regard to the initial area %CW Percent of Cold Work %CW Ao An 100 Ao 2. Using data from the last table, chart the percent of cold work (%CW) vs. hardness (HR). Explain this graph’s usefulness and the information it provides. (5 pts.) Hardness [HR ] %CW Pág. 2 de 4 Laboratory of Engineering Materials I Department of Mechanical Engineering 3. Do the tensile stress test on two pieces and complete the next table using data obtained from this test. (10 pts.) Piece w/o cold work Piece from the step 3 of cold work Units Yield Strenght (y ó YLD) Ultimate Tensile Strenght (uts ó MAX) Fracture Strenght (BRK) % Elongation %elongation = (L fracture L0 - L0 ) *100% 4. Develop a stress-strain graph showing both of the pieces analyzed before. (5 pts.) 5. QUESTIONS AND CONCLUSIONS (10 pts.) a) Explain how both length and area behave throughout all of the cold work steps. Is this change constant? Pág. 3 de 4 Laboratory of Engineering Materials I Department of Mechanical Engineering b) Explain how the grain structure in a piece changes due to cold work. c) According to values obtained in the tensile stress test, what were the changes in the mechanical properties of the pieces? (Rigidity, ductileness, mechanical strength.) d) Describe your conclusions. Pág. 4 de 4
