A Light Introduction
advertisement
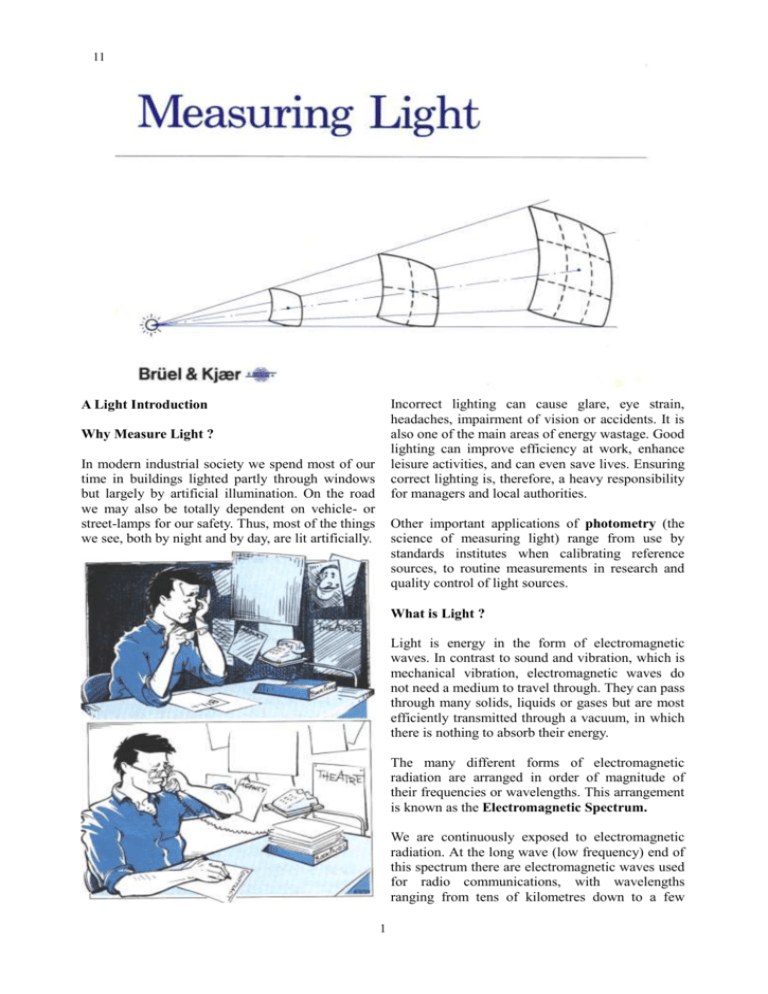
11 Incorrect lighting can cause glare, eye strain, headaches, impairment of vision or accidents. It is also one of the main areas of energy wastage. Good lighting can improve efficiency at work, enhance leisure activities, and can even save lives. Ensuring correct lighting is, therefore, a heavy responsibility for managers and local authorities. A Light Introduction Why Measure Light ? In modern industrial society we spend most of our time in buildings lighted partly through windows but largely by artificial illumination. On the road we may also be totally dependent on vehicle- or street-lamps for our safety. Thus, most of the things we see, both by night and by day, are lit artificially. Other important applications of photometry (the science of measuring light) range from use by standards institutes when calibrating reference sources, to routine measurements in research and quality control of light sources. What is Light ? Light is energy in the form of electromagnetic waves. In contrast to sound and vibration, which is mechanical vibration, electromagnetic waves do not need a medium to travel through. They can pass through many solids, liquids or gases but are most efficiently transmitted through a vacuum, in which there is nothing to absorb their energy. The many different forms of electromagnetic radiation are arranged in order of magnitude of their frequencies or wavelengths. This arrangement is known as the Electromagnetic Spectrum. We are continuously exposed to electromagnetic radiation. At the long wave (low frequency) end of this spectrum there are electromagnetic waves used for radio communications, with wavelengths ranging from tens of kilometres down to a few 1 22 millimetres. At the other (high frequency) end of the electromagnetic spectrum there are X-rays and gamma rays which have wavelengths that are very small indeed. Only a small part of this radiant energy can be perceived by the human eye. This is what we call light. Light makes up the small region of wavelengths from 380 to 780 nanometres (10-9 m). The eye is able to detect different wavelengths in this range of radiation and gives the sensation of colour. Blue and violet correspond to the short wavelengths, red to the long, and yellow and green to the middle of the visible range. The V(λ) curve is of fundamental importance in measuring light since it has been internationally agreed to base all light measurements on this sensitivity curve whatever the level of illumination. Vision and the V(λ) curve Light entering the eye through the cornea and the lens creates an image on the retina which senses the light and transmits the information to the brain through the nerves. The retina has two kinds of light sensitive receptors: cones and rods. The cones are used for photopic vision: seeing in conditions of high illumination. There are three types of cones each of which covers a different spectral range. This is what makes colour vision possible. The rods are more sensitive than the cones and thus make scotopic vision (seeing in the dark) possible. Since the rods have no facility for spectral discrimination scotopic vision is without colour. The accuracy with which an instrument complies with this curve in terms of its sensitivity to light of different colours is known as its spectral match. The sensitivity of the human eye is not uniform over the visible range but varies with the wavelength of the light. When adapted to high illumination levels the maximum sensitivity of the eye is determined by the cones and occurs at a wavelength (λ) of 555 nm. When the rod system only is utilised however (in the dark) the maximum sensitivity corresponds to λ= 510 nm. The range in between, over which both rods and cones are used, is called mesotopic vision. Two sensitivity curves are internationally recognised: (1) The spectral luminous efficacy for photopic (cone or light-adapted) vision or V(λ) curve and (2) The spectral luminous efficacy for scotopic (rod or darkadapted) vision. Natural Sources of Light Sunlight This is by far the most powerful light source 2 33 affecting the earth. Mankind has always been dependent on the sun. It is essential to the provision of warmth and food and is the world's most important source of light. “Man-made” Sources Electric lamps may be divided into two main groups: incandescent and discharge. Discharge lamps may be further divided according to whether the gas is contained at low or high pressure. Moonlight The moon shines by reflecting sunlight. The distance between the sun and the moon and the low reflectance of the moon's surface both contribute to its luminance being over half a million times less than that of the sun. The light from an incandescent lamp is generated by bringing a filament to a high temperature. This is achieved due to the heating action of the electric current passed through it when the lamp is switched on. Before any light is produced the temperature of the filament must rise above600oC. Lightning Lightning is a meteorological phenomenon. It is the visible electric discharge between clouds or cloud and ground. This effect arises from the accumulation of electrical charges in the formation of clouds which can suddenly be released in a spark-type discharge to earth. Filament materials should have a high melting point, low vapour pressure, high strength, high ductility, as well as suitable radiation and electrical resistance characteristics. Due to a very favourable combination of these desirable properties tungsten is used for nearly all lamp filaments. Aurora Borealis (Northern Lights) and Aurora Australis (Southern Lights) These consist of hazy horizontal patches or bands of greenish light on which white, pink, or red streamers are sometimes superimposed. They are caused by electron streams spiralling into the atmosphere, primarily at polar latitudes. Bioluminescence This is the name given to the emission of light by living organisms. Several species of plant and animal are able to manufacture compounds which give out light when exposed to oxygen. Discharge lamps have no filament, but produce light by the excitation of gas contained between two electrodes. In a low-pressure mercury-vapour fluorescent lamp electrodes are sealed into the ends of a tubular bulb. When a current is passed through the gas mixture, predominantly ultraviolet radiation is produced. For this reason the inner surface of the tube is often coated with fluorescent powders (generally phosphor crystals) which 3 44 transform this U.V. radiation into (visible) light. Spectra of Light Sources distribution in the energy they emit. The radiant-flux or electromagnetic-power spectra of different light sources varies considerably. A tungsten-filament (incandescent) lamp, for example, emits most of its radiant energy in the infrared region of the electromagnetic spectrum. This is obviously inefficient in terms of the conversion of electrical energy into light. Incandescent lamps are, however, cheap and easy to work with. In the following section we will look at some of the theory behind photometry. Most of the energy radiated by a fluorescent lamp, on the other hand, is emitted as visible light. This gives fluorescent lamps a relatively high efficacy and good colour rendering properties. They have a long life compared to incandescent lamps but are more expensive and more complicated electronically. Some fluorescent lamps are monochromatic: they emit light at just one wavelength or spectral line. The light emitted by a more typical fluorescent tube consists of several prominent spectral lines. Daylight consists of a much more even spread of wavelengths. Lamp manufacturers often aim to make fluorescent lamps which reproduce this Some Light Theory: An Overview This drawing should provide a useful summary of some of the basic concepts in lighting and help illustrate how they relate to each other. A more detailed discussion of these concepts is given in the following pages. 4 55 the peak of the V(λ) curve. At this wavelength one watt of radiation is said to produce a luminous flux of 683 lumens. This “maximum possible conversion from radiant flux to visual sengation” has been given the symbol Km and is used as a scaling factor in the calculation of luminous flux in order to give the result in units of lumens/watt. Luminous flux In the visible range, radiant flux is considered to have a luminous flux, $, which is a measure of the visual response. The luminous flux from a light source is found by weighting the radiant flux, P(λ), at each wavelength by the CIE standardised sensitivity curve for photopic vision, V(λ), and then integrating over the whole visible range. Typical values for the luminous flux of some common light sources are shown in the diagram. By comparing the luminous flux to the electrical power consumed, sources can be classified according to their Luminous Efficacy. If, for example, a source is consuming electrical power at a rate of 60 watts to produce a luminous flux of 5001m, the luminous efficacy, η, of this source is 500/60 = 8,31m/W. Similarly we find that a typical efficacy of a tungsten lamp is: η = 1000/100 = 10lm/W and that of a fluorescent tube is: η = 3000/40 = 751m/W. In the case of discharge lamps efficacy increases with the power consumption of the lamp. Although the low pressure sodium lamp type has a very high efficacy its poor colour-rendering ability makes it less desirable for use on roads. In some countries the use of the high-pressure type is therefore recommended for safety reasons. The eye is most sensitive to radiation at 555 nm, 5 66 Luminous Intensity The luminous intensity, I, is a measure of the light output in a given direction. It is the basic parameter in photometry and is defined as the luminous flux from a source in a specified direction, inside a small solid angle. Examples of Luminous Intensity A table or polar diagram of the intensity distribution around a light source can be built up from luminous intensity measurements. The diagram gives a good graphical representation of the light distribution whereas a table is more useful if further calculations are to be made. In the diagram the dotted isocandela curve represents the lamp alone whilst the solid curve shows the effect of using a reflector or "shade". The solid angle, ω, is expressed in terms of steradians and is a way of describing the ‘broadness’ or ‘narrowness’ of cones and pyramids relative to a sphere. The apexes of these cones and pyramids can be imagined as being at the centre of a sphere, with the bases making up part of the surface area of that sphere. The biggest solid angle possible is the sphere itself. This has a volume of 4π or 12, 5664 steradians. A beam of light from a lighthouse, on the other hand, has a solid angle of less than a 1/20 of a steradian. I In the case of luminaires the light distribution varies with the shape of the light source itself and the design of the fixture. A polar diagram for a luminaire is usually plotted in terms of candela per 1000 lumens of lamp flux so the power of the lamp used can be varied without affecting the validity of the diagram. The type of lamp must, however, remain the same. In theory the equation only applies to a point source since, by definition, a solid angle must have a point at its apex. In practice, however, results obtained using this equation are satisfactory provided only that the dimensions of the source are small compared with the distance from which it is observed. The diagrams and tables for luminaires with asymmetrical light distributions must provide information on the intensity in at least two planes. These are normally the vertical plane through the longitudinal axis of the luminaire and the plane at right-angles to that, known as the transverse plane. The unit for luminous intensity is the candela (cd). A source radiating 1 1m through a solid angle of 1 sr, gives an intensity in that direction of 1 cd. In one commonly used intensity-distribution measurement-technique the luminaire is rotated about two axes while the photocell remains 6 77 stationary. If a more comprehensive survey of the intensity distribution is required then the luminaire may be kept stationary whilst the photocell is moved over a hemispherical path. the surface due to the angle of incidence. Light striking a surface at large angles will result in a smaller illuminance than light striking the surface at small angles because less of the luminous flux is intercepted by that area. The maximum illuminance will be obtained when the angle of incidence is zero i.e. when the surface is perpendicular to the beam direction. Luminous-intensity distribution diagrams are particularly important when it comes to finding the most suitable luminaire for a particular application. If there is more than one source, the resulting illuminance is the sum of the contributions from each source. Illuminance When light emitted from a source strikes a surface that surface will be illuminated. Examples of llluminance The Illuminance, E, is thus defined as the luminous flux incident on a surface per unit area of that surface. E The range of illuminances encountered in daily life varies by a factor of more than a million. A few approximate values are shown in the diagram. A A In many circumstances the illuminance on a horizontal surface, En, does not correspond very well with the visibility of the thing which has to be seen. In the case of facial recognition (in street at night, for example) a much better parameter is the semi-cylindrical illuminance, ESC. This is simply because the light falling on a semi-cylinder corresponds better to that which falls on the body of a pedestrian. If we now consider what illuminance we should measure to see if a road surface is properly lit and, once again, we take into account the the obstacles on the road and the directionality of the light, we find that hemispherical illuminance, EHS. is a much better When light of 1 lumen falls on a surface of 1 m2 the illuminance of that surface is 1 lux (lx). The illuminance on a particular surface is related to the intensity of the light source through the formula: E I cos v d2 where I is the intensity of the source in the direction of the surface and d is the distance between the source and the surface. The factor cos v accounts for the reduction in light striking 7 88 measure of the visibility of objects in the road or of the kerb than horizontal illuminance. Once again, the explanation is simple: the visibility of these objects depends to quite a large extent on light falling on their vertical surfaces; and this light is only measured (or given the correct weighting) in the case of hemispherical illuminance measurements. material and is read from a table of values. If the surface is diffuse then ß can be replaced with ρ, the diffuse reflection coefficient for the material. A typical luminance for a piece of white paper under an illuminance of 500 lux is thus 130cd/m2. The eye can detect luminances from as little as one millionth of a cd/m2 up to a maximum of one million cd/m2.The upper limit is determined by the luminance required to damage the retina. The reason that our eyes are so easily damaged by looking at the sun is explained when we see that its luminance is 1000 times greater than this maximum level. Luminance When a part of the incident light striking a surface is reflected the human eye will observe that surface as a light source. The brightness observed is called the Luminance, L, and is defined as intensity per unit apparent area of light source. The apparent area, A', is the area the source seems to have as seen by the observer. Thus, L IU A Contrast on a Document Contrast plays an essential role in vision. The process of seeing is made up of a succession of individual viewing actions, each of which consist of the perception of one or several details against their background. To distinguish these details there has to be a certain difference between their luminance and the luminance of the background. This distinction is expressed by the luminance contrast, C: where A’ tends to 0. For a plane surface the apparent area can be found from the equation: A’ = Acos u, where A is the actual area of the source, and u the angle between the normal to the surface and the direction of observation, IU is the luminous intensity in that direction. C Alternatively, the luminance of a surface can be calculated from the formula L E Ld Lb Lb where Ld is the luminance of the detail and Lb the background luminance (i.e. that of the paper). where ß is the luminance factor of the surface The luminance of a surface varies with the angle 8 99 of the incident light and the observation angle. When these two angles are equal the contrast will normally be at a minimum and reflection of light off the document is most likely to be a problem. This makes it difficult or impossible to distinguish parts of the text. The extent to which this phenomenon will affect the visibility of the text is often not easy to evaluate since it depends not only on the lighting but also on the type of document and the reflection characteristics of the detail. The contrast of the document will generally decrease the more glossy the paper and will also vary depending on whether ink, pencil, type, or print is used. shown. A luminance transducer and contrast standard are mounted in a carriage on a radius arm so that they can be positioned accurately. The contrast meter calculates the contrast from the luminance measurements made at each point; the results can then be entered directly onto a map of the standard work surface. In order that the contrast of documents can be considered during the design stage of lighting systems in schools, offices, and libraries etc. the CIE has introduced the Contrast Rendering Factor, CRF. This is defined as the ratio of the contrast of a task under the installed lighting, C, to its contrast under diffuse sphere illumination, GREF In order to make repeatable measurements of the contrast in different locations and under a variety of lighting conditions, it is necessary to use an object which has well specified and consistent reflectance characteristics over a wide range of illuminance and viewing angles. Accurate values for contrast rendition are also most easily obtained using a contrast standard. The acronym CRFR is often used to indicate that a reference standard has been used for the measurement. A contrast standard is shown in the diagram. The greatest contrast will occur under side lighting; at places where reflections occur, the luminance of the dark contract-taskis practically equal to that of the light contrast-task: there is almost no contrast at all. For this purpose a contrast standard has been designed. A contrast standard consists of a dark field and a light field simulating character and background respectively. Measurement of the luminance of these fields in a particular location in the work area can be performed with a luminance transducer. The contrast can then be calculated in accordance with the formula shown on the previous page. In the diagram a system for measuring contrast is Contrast on VDU Screens Many parameters influence the readability of a Visual Display Unit (VDU) screen. The luminance, 9 1010 dots (pixels) ~3 cm2 are generated on the screen. The character luminance, Lc, at each point is measured by pointing the photocell at the dot-field or cursor (from the normal viewing distance); the background luminance, Lb, is then measured without the dot-fields or cursor on the screen. contrast, dimensions, sharpness, and the colour of the characters all have a significant effect. The most important of these is, per haps, the contrast between the characters on the screen and that of the background and it is this simple ratio that is most commonly used to define CS, the contrast on the screens of visual display units: Glare L Cs d Lb Annoyance, discomfort, or loss in visual performance and visibility caused by a luminance within the visual field which is greater than the luminance to which the eyes are adapted is called glare. Despite many different causes of glare most occurrences can be classified as either discomfort- or disability glare. Ld is the luminance of the detail on the screen (a character, for example) and Lb is the luminance of the background. The measurement of contrast on the screen of a VDU is similar to that on a horizontal work surface. The same measurement cell and contrast meter can be used but measurements are made directly from the screen and not from the contrast standard. Note that the contrast must be measured from the typist's position and the measurement cell pointed towards the area on the screen which is to be evaluated. The person recording the contrast conditions at the workstation simulates the body shadow of the typist by sitting in the appropriate position whilst taking the measurements. Discomfort Glare Discomfort glare is annoying but does not necessarily prevent the performance of the visual task in question. It is often attributed to the eye's tendency to fix upon the brightest spots within the field of view and is thus related to phototropism (the way in which plants are drawn towards light). The degree of discomfort produced by a luminaire is dependent upon four main parameters: the luminance of the source, the size of the source, the angle between the source and the observer's line of sight, the adaption level of the observer's eye. Disability Glare Disability glare prevents the performance of the visual task and can be caused in three different ways: 1) Scatter of light in the lens of the eye producing a veiling luminance on the retina 2) Insufficient time for the eye to adapt to the new vastly different illuminance 3) After- or ghost images. Most of us experience this strange phenomenon after having our photograph taken, during night-time driving, or on encountering reflections of the sun on a bright summer day. The photochemical processes essential to our vision are temporarily disturbed due to the eye becoming “overloaded” with light. The brain becomes confused and we continue to see a succession of images of the bright object or reflection, alternatively positive and negative of irregular strength and of decreasing frequency. Full vision is normally restored within 5 or 10 minutes of the event. Direct measurement of the contrast of something as small as a character on a VDU screen can be acheived with an illuminance meter with focus and 1/3º acceptance angle. With instruments of minimum acceptance angle 2º, uniform fields of 10 1111 There are many different ways of avoiding disability glare. You may shade lamps, pull curtains or blinds over windows or reduce reflectance by using matt materials and by positioning desks, terminals and light-sources carefully. In certain circumstances, such as playing outdoor sports on a sunny day you have to make do with shading your eyes with a pair of sun glasses or a visor. Card players and desk-clerks used to wear visors to shade their eyes from the light-source they were using. detector directly onto the screen. These values, along with the luminance of the background (including reflections), Lb, are an important aid to defining the most suitable setting for the screen luminances. Assessing the character-contrast on keyboards and the ratio of mean luminance between the manuscript and the screen are also particularly important. The eyes of a typist may have to focus alternately on the manuscript and screen several thousand times a day. If this ratio is greater than a factor of 5 eye strain may well result. In the proposed ISO standard DP9241 a maximum ratio of 1 to 10 is recommended. Some Light Work Measuring On VDU Screens Luminance distribution and contrast conditions at the workplace can be entered into a measurement-report form like the one shown in the diagram. A measurement report should be made for each work station in the room, for one or more typical ambient lighting situations. Together these reports form a good base for the planning of improvements. The measurement results recorded here are the contrast conditions at a word processing terminal. The lighting system consisted of a ceiling luminaire mounted directly above the work place and gave rise to the reflection marked on the screen. The contrast of the 9 fixed dot-fields are given and should be supplemented by a minimum contrast for the whole screen, as shown. When all the measurements have been recorded in this way the report form can be studied and used as a guide to what problems exist at the work-station. Recommendations can then be made as to how visual conditions may be improved and once these have been implemented the analysis can be repeated to check the improvement. L*C and screen-generated L*B — the luminances---should be measured in a dark room or, if this is not possible, by placing the luminance 11 1212 Under normal road-lighting conditions, values of semi-cylindrical illuminance, ESC, and hemispherical illuminance, EHS. provide a better assessment of the visibility of three dimensional objects than horizontal illuminance, EH, measurements. The CIE have proposed typical semi-cylindrical, hemispherical, and horizontal illuminance values required to enable pedestrians to assess the attitude of other persons from at least 4m away. Sport Lighting and Stage Lighting Sport lighting and stage lighting installations are designed mainly on the basis of what illuminance levels are required by actors, players, their audience, and sometimes television cameras. With sports lighting the main visual tasks for both players and spectators are both vertical and three-dimensional: following movements of the players and the ball. The illuminance of the playing surface and its markings is usually of secondary importance. Lighting of Residential Areas Not surprisingly visibility of 3-dimensional objects---the most important parameter in sport and stage lighting---is more closely correlated to illuminance on a semi-cylindrical surface than that measured on a flat or hemi-spherical surface. Night-time lighting in urban areas must fulfil several requirements. Motorists need to be able to see people or objects on the road and kerb. Cyclists and pedestrians also have to make sure that their path is not obstructed. This can be partly explained by the fact that the semi-cylindrical-adaptor surface is more similar in 12 1313 shape to that of a standing person. The visibility of both are influenced to a far greater extent by side and/or front lighting than by vertical lighting. This is part of the reasoning behind the introduction of semi-cylindrical illuminance, ESC, as a better measure of the quality of stage, sport, and television lighting. Road Lighting The safety and comfort of a road user deteriorates considerably with the onset of darkness. Studies in many countries and by many different institutions have shown that road lighting can help to reduce night-time accidents by more than 30%. A reduction by this amount will usually be more than sufficient to offset installation and running costs of good road lighting. Lighting Criteria Whilst driving, our visual performance or — “how well we can see” — is determined, to a large extent, by the speed at which we are travelling, the level of lighting, and the reflectance of the road surface. To take all these things into account road-lighting specifications should be in terms of the average luminance of a roads surface at between 60 to 160 meters in front of the driver. Road-lighting standards state that average road-surface luminances should vary from: 0,5 cd/m2 for roads with traffic of very low density and limited speed; to 2 cd/m2 for roads where density and speed of traffic are high. Lighting Criteria Best indicator of Visual performance Recommended value Level Uniformity Glare Average surface Luminance Overall uniformity Threshold increment TI Lav Uo 0.5-2 cd/m2 0.4 10-20% Two other parameters which are essential in assessing visibility on the roads at night are the uniformity of the light and the degree of disability glare due to the lighting. To ensure not only a good average but also a certain minimum visual performance at all locations on the road, lighting specifications normally include a minimum value for overall uniformity, UO. This is the 13 1414 ratio between the minimum and the average road-surface luminance. The degree of disability glare due to road lighting is normally assessed by calculating a value known as the thresh old increment (TI). Threshold increment values are only valid if the average road-surface luminance lies between 0.05 and 5 cd/m2. Adequate luminance uniformity is important for both visual comfort-and visual performance. Investigations have revealed that both the overall uniformity ratio, Uo, and the longitudinal uniformity ratio, Ui, have to be within certain limits in order to specify adequate road lighting. The longitudinal uniformity ratio, UI (Lmin / Lmax measured along the middle of a traffic lane) should not be below 0, 7 on motorways if an uncomfortable impression of patchiness is to be avoided, whereas the overall uniformity Uo (Lmin/Lav) should nowhere be below 0, 4 so as to ensure good visual performance. Measurements on roads Practical measurements from a motorway from the driyer's eye point are illustrated. The measurement field angle is 1ºand the observation angle is 3º to the road surface The level-recorder was synchronized with the car's speed (~100 mm/km). Many of the lamps were not working due either to failure or to money saving measures. This can be seen on the recording by the general low levels and the rapid fall of luminance in many places. The projection of the measurement field on the road surface forms an ellipse which in this case has a length of 8 m and a width of 0.44 m. Compared with the distance between lamp posts (25m) the resolution is fairly good. The sidelights only were used during the measurements. A typical set-up is shown on the previous page. Since perfect spectral and cosine weighting is not possible, a third requirement---for accurate measurements whatever the spectral and spatial distribution of the light---is detailed documentation of the cosine and spectral sensitivity of the instrument. The influence of temperature on the optics should also be well documented. Designing Light Measuring Instruments Some of the most essential features of a light measuring instrument, or photometer, are shown in the diagram opposite and the block diagram on the following page. The transducer (optics, filters, and silicon detector) ensures that the signal (current) it sends to the amplifier is proportional to the light being measured. An amplifier is necessary to ensure that very low light powers can be accurately determined by the transducer. The fact that the offset of any amplifier varies with time means that automatic zero drift compensation saves the user a lot of time and reduces the opportunity for error. This implies also that a transducer for illuminance measurements must have a weighting as close as is possible to a) standardised human vision, V(λ) b) angular cosine response The transducer itself should have a wide dynamic 14 1515 range, and stable output with regard to temperature, for example. Again, some change in sensitivity can be expected with a change in temperature. This too should be well documented so that the user can check to see at what temperatures some sort of extra compensation has to be made. 15
