Physics Lab Report Format & Sample Experiment
advertisement
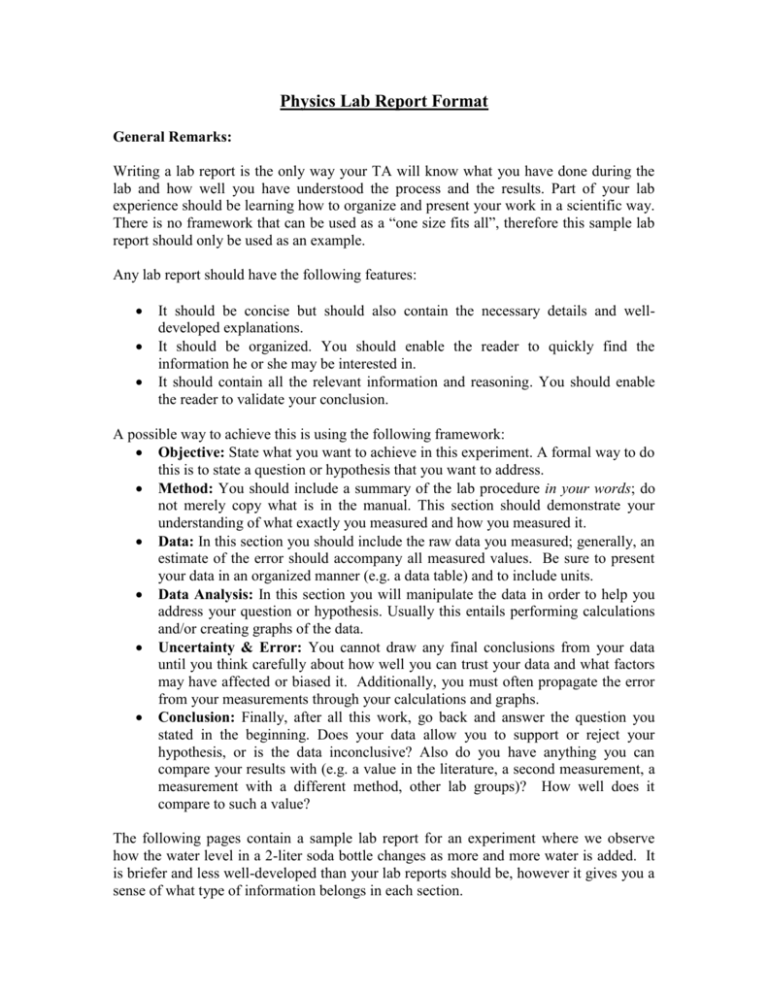
Physics Lab Report Format General Remarks: Writing a lab report is the only way your TA will know what you have done during the lab and how well you have understood the process and the results. Part of your lab experience should be learning how to organize and present your work in a scientific way. There is no framework that can be used as a “one size fits all”, therefore this sample lab report should only be used as an example. Any lab report should have the following features: It should be concise but should also contain the necessary details and welldeveloped explanations. It should be organized. You should enable the reader to quickly find the information he or she may be interested in. It should contain all the relevant information and reasoning. You should enable the reader to validate your conclusion. A possible way to achieve this is using the following framework: Objective: State what you want to achieve in this experiment. A formal way to do this is to state a question or hypothesis that you want to address. Method: You should include a summary of the lab procedure in your words; do not merely copy what is in the manual. This section should demonstrate your understanding of what exactly you measured and how you measured it. Data: In this section you should include the raw data you measured; generally, an estimate of the error should accompany all measured values. Be sure to present your data in an organized manner (e.g. a data table) and to include units. Data Analysis: In this section you will manipulate the data in order to help you address your question or hypothesis. Usually this entails performing calculations and/or creating graphs of the data. Uncertainty & Error: You cannot draw any final conclusions from your data until you think carefully about how well you can trust your data and what factors may have affected or biased it. Additionally, you must often propagate the error from your measurements through your calculations and graphs. Conclusion: Finally, after all this work, go back and answer the question you stated in the beginning. Does your data allow you to support or reject your hypothesis, or is the data inconclusive? Also do you have anything you can compare your results with (e.g. a value in the literature, a second measurement, a measurement with a different method, other lab groups)? How well does it compare to such a value? The following pages contain a sample lab report for an experiment where we observe how the water level in a 2-liter soda bottle changes as more and more water is added. It is briefer and less well-developed than your lab reports should be, however it gives you a sense of what type of information belongs in each section. Lab Report – Soda Bottle Experiment Hypothesis: Given that a soda bottle roughly resembles a cylinder, we expect a linear relationship between the height of the water and the amount of water filled in. Method: We measure the height of the water after filling in equal amounts of water. To test for the linear relationship, we will make a best line fit in a V-h diagram. Raw Data: Volume filled in (mL) 0 250 500 750 1000 1250 1500 1750 2000 2250 Height of Water Level (cm) 0 4.0 6.6 9.1 11.7 14.2 16.8 19.2 22.0 26.5 Uncertainty & Error: Uncertainty: We were able to measure the volume with a precision of ±25mL and the water level with a precision of ±0.5cm. Major Sources of Error: Systematic: In particular at the lower and upper end of the bottle we have indentions that make the shape of the bottle deviate from a cylindrical shape. This should overall shift the curve upwards. (Can be avoided by only measuring the height gain for the middle part of the bottle.) Ruler held at an angle. This will result in an over-estimate of h. (Can be avoided by holding ruler perpendicular.) Residual water in the bottle. This will again shift the entire curve upwards. (Can be avoided by having the bottle carefully dried.) Bubbles in the water. This will result in an overestimation of the volume. (Effect can be reduced by letting water sit before measurements). Random: Change in temperature in water (thermal expansion). Misreading the ruler. Data Analysis: 30.0 25.0 Height in cm 20.0 15.0 Data Reviewed Data Linear (Data) Linear (Reviewed Data) 10.0 5.0 0.0 0 500 1000 1500 2000 2500 -5.0 Volume in mL Quality of fit: The best fit line fits the data pretty well, except for the last data point. If we omitted the first and the last data point (which we should do, because of the indentions in this part of the bottle), the data points fall on an almost perfect best-fit-line (with a non-zero intercept). All data points fall on the best-fit line within their uncertainty. Parameters: If we base our best fit on the middle 8 data-points, we obtain: Slope: 10.2±0.5 cm/L Intercept: 1.5±0.3 cm Conclusions: Our expectation of a linear relationship between volume and height seems correct. The data very well supports this notion as the data falls on a straight line in the V-h graph. The fact that the intercept is non-zero (as we would expect) can be accounted for by the indentations at the lower end of the bottle. The slope has little physical meaning, except that it is proportional to the average area of the bottle.
