CAPITAL BUDGETING AND CASH FLOW PRINCIPLES
advertisement
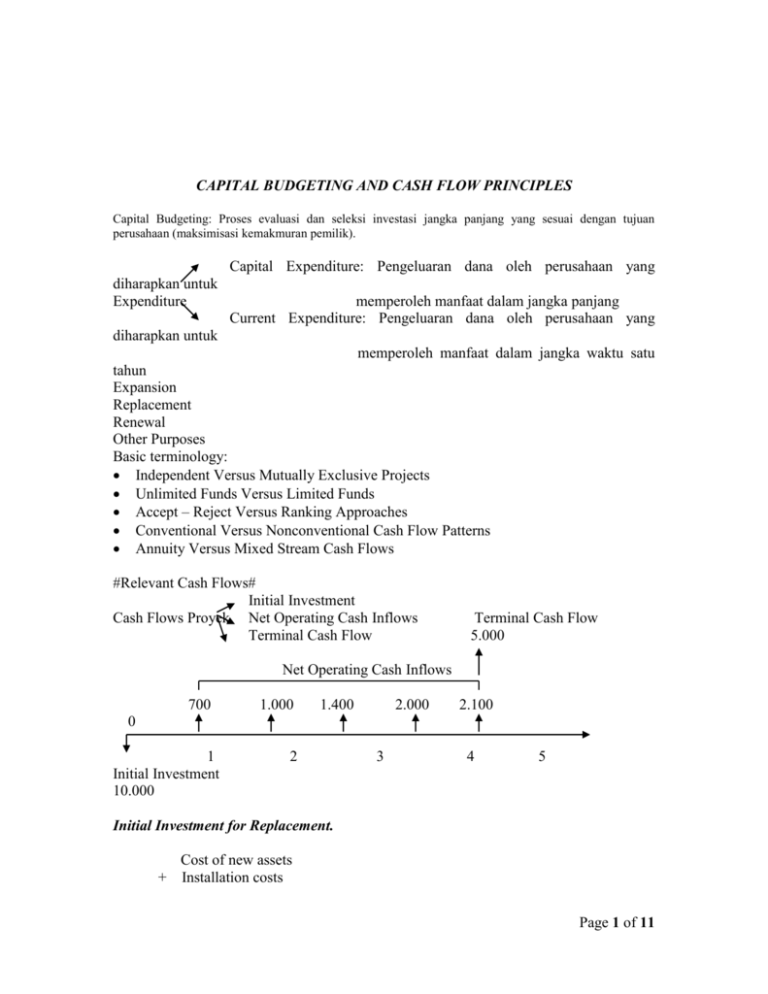
CAPITAL BUDGETING AND CASH FLOW PRINCIPLES Capital Budgeting: Proses evaluasi dan seleksi investasi jangka panjang yang sesuai dengan tujuan perusahaan (maksimisasi kemakmuran pemilik). Capital Expenditure: Pengeluaran dana oleh perusahaan yang diharapkan untuk Expenditure memperoleh manfaat dalam jangka panjang Current Expenditure: Pengeluaran dana oleh perusahaan yang diharapkan untuk memperoleh manfaat dalam jangka waktu satu tahun Expansion Replacement Renewal Other Purposes Basic terminology: Independent Versus Mutually Exclusive Projects Unlimited Funds Versus Limited Funds Accept – Reject Versus Ranking Approaches Conventional Versus Nonconventional Cash Flow Patterns Annuity Versus Mixed Stream Cash Flows #Relevant Cash Flows# Initial Investment Cash Flows Proyek Net Operating Cash Inflows Terminal Cash Flow Terminal Cash Flow 5.000 Net Operating Cash Inflows 700 1.000 1.400 2.000 2.100 0 1 Initial Investment 10.000 2 3 4 5 Initial Investment for Replacement. + Cost of new assets Installation costs Page 1 of 11 - Proceeds from sale of old assets -/+ Taxes on sale of old assets -/+ Change in net working capital ----------------------------------------Initial Investment Net Operating Cash Inflows. Revenue - Expenses (excluding depreciation) -----------------------------------------Profits before depreciation & taxes - Depreciation ------------------------------------------Profits before taxes - Taxes ------------------------------------------Net Profits after taxes + Depreciation ------------------------------Net Operating Cash Inflows Terminal Cash Flow. Proceeds from sale of new asset - Proceeds from sale of old asset -/+ Taxes on sale of new assets -/+ Taxes on sale of old assets -/+ Change in net working capital --------------------------------------------Terminal Cash Flow # Capital Budgeting Techniques# Payback Period Net Present Value Internal Rate of Return Page 2 of 11 POLA ALIRAN KAS TYPE Conventional Conventional Conventional Non Conventional Non Conventional Non Conventional SIGN ON NET CASH FLOW 0 1 2 3 4 5 6 - + + + + + + + + + + + + + + + - + + + + + + + - + + + + NUMBER OF SIGN CHANGE 1 1 1 2 2 3 Contoh: I. Proyek Expansi. Suatu perusahaan Otobus membeli bus eksekutif baru dengan harga Rp 1.000.000.000,00 melayani penumpang antar propinsi dan bus diperkirakan berumur ekonomis 10 tahun. Biaya surat-surat Rp 5.000.000,00 dan modal kerja yang harus disediakan diperkirakan Rp 5.000.000,00. Estimasi pendapatan per tahun Rp 300.000.000,00. Biaya per tahun (Operasi dan pemeliharaan) Rp 50.000.000,00. Bus pada akhir umur ekonomis dapat dijual dengan harga Rp 50.000.000,00. Pajak 10 %. Dari data tersebut dapat dihitung Initial Investmentnya: Initial Investment. Harga pembelian bus Biaya surat-surat Modal kerja Initial Investment Net Operating Cash Inflow Pendapatan Biaya Operasi Biaya depresiasi Laba Operasi Bunga Laba Sebelum Pajak (EBT) Pajak 10 % Laba Setelah Pajak Depresiasi Net Operating Cash Inflow (Proceeds) Rp 1.000.000.000,00 Rp 5.000.000,00 Rp 5.000.000,00 Rp 1.010.000.000,00 Rp Rp Rp Rp Rp Rp Rp Rp Rp 300.000.000,00 50.000.000,00 100.000.000,00 150.000.000,00 0,00 150.000.000,00 15.000.000,00 135.000.000,00 100.000.000,00 235.000.000,00 Page 3 of 11 Terminal Cash Flow. Hasil Penjualan Bus Pajak Penjualan 10 % Net Cash Flow Rp Rp Rp Annuity = Rp 1 2 Rp 1.010.000.000,00 II. 3 4 5 6 50.000.000,00 5.000.000,00 45.000.000,00 Rp 235.000.000,00 7 8 45.000.000,00 9 10 Proyek Penggantian. Perusahaan XYZ sedang mempertimbangkan untuk mengganti mesin lama dengan mesin baru. Harga beli mesin baru Biaya instalasi mesin Umur ekonomis Rp 380.000,00 Rp 20.000,00 5 tahun Harga beli mesin lama 3 tahun yang lalu Harga jual mesin lama saat ini Umur ekonomis Rp 240.000,00 Rp 280.000,00 5 tahun Dengan penggantian ini, perusahaan mengestimasi akan terjadi kenaikan asset lancar sebesar Rp 35.000,00 dan kewajiban lancar Rp 18.000,00 Pajak 10 % Initial Investment Harga beli mesin baru Biaya instalasi mesin Proceeds penjualan mesin lama Pajak penjualan mesin lama *) Perubahan modal kerja bersih Initial Investment Ket: Rp Rp Rp Rp Rp Rp 380.000,00 20.000,00 280.000,00 18.400,00 17.000,00 155.400,00 *) Nilai buku mesin lama 240.000 – 144.000 = Rp 96.000,00 Pajak 10% (280.000 – 96.000) = Rp 18.400,00 Page 4 of 11 Net Operating Cash Inflow. Selanjutnya diketahui bahwa estimasi pendapatan dan biaya per tahun diluar depresiasi untuk kedua mesin selama 5 tahun sebagai berikut: TAHUN 1 2 3 4 5 TH 1 2 3 4 5 TH 1 2 3 4 5 TH 1 2 3 4 5 MESIN PENDAPATAN Rp 2.520,00 Rp 2.520,00 Rp 2.520,00 Rp 2.520,00 Rp 2.520,00 MESIN BARU PENDAPATAN BIAYA Rp 2.520,00 Rp 2.520,00 Rp 2.520,00 Rp 2.520,00 Rp 2.520,00 MESIN PENDAPATAN Rp 2.200,00 Rp 2.300,00 Rp 2.400,00 Rp 2.400,00 Rp 2.250,00 NO MESIN BARU Rp 206,00 Rp 206,00 Rp 206,00 Rp 206,00 Rp 206,00 Rp 2.300,00 Rp 2.300,00 Rp 2.300,00 Rp 2.300,00 Rp 2.300,00 LAMA BIAYA Rp 1.990,00 Rp 2.110,00 Rp 2.230,00 Rp 2.250,00 Rp 2.120,00 BARU BIAYA Rp 2.300,00 Rp 2.300,00 Rp 2.300,00 Rp 2.300,00 Rp 2.300,00 MESIN PENDAPATAN Rp 2.200,00 Rp 2.300,00 Rp 2.400,00 Rp 2.400,00 Rp 2.250,00 LABA SEBELUM DEP. & PAJAK Rp 220,00 Rp 220,00 Rp 220,00 Rp 220,00 Rp 220,00 Rp 80,00 Rp 80,00 Rp 80,00 Rp 80,00 Rp 80,00 Rp 140,00 Rp 140,00 Rp 140,00 Rp 140,00 Rp 140,00 Rp 14,00 Rp 14,00 Rp 14,00 Rp 14,00 Rp 14,00 Rp 206,00 Rp 206,00 Rp 206,00 Rp 206,00 Rp 206,00 Rp 210,00 Rp 190,00 Rp 170,00 Rp 150,00 Rp 130,00 Rp 48,00 Rp 48,00 Rp 0,00 Rp 0,00 Rp 0,00 Rp 162,00 Rp 142,00 Rp 170,00 Rp 150,00 Rp 130,00 Rp 16,20 Rp 14,20 Rp 17,00 Rp 15,00 Rp 13,00 Rp 193,80 Rp 175,80 Rp 153,00 Rp 135,00 Rp 117,00 CIF MESIN LAMA Rp 193,80 Rp 175,80 Rp 153,00 Rp 135,00 Rp 117,00 DEPRE SIASI Rp Rp Rp Rp Rp LAMA BIAYA 1.990,00 2.110,00 2.230,00 2.250,00 2.120,00 NOCIF EBIT PAJAK 10% RELEVANT CASH FLOW Rp Rp Rp Rp Rp 12,20 30,20 53,00 71,00 89,00 TERMINAL CASH FLOW. Jika diketahui bahwa mesin yang baru laku dijual Rp 50.000,00 dan perusahaan berharap akan menutup modal kerja bersih Rp 17.000,00, maka aliran kas akhir umur proyek. Penjualan mesin baru Pajak penjualan mesin baru Perubahan modal kerja bersih Terminal Net Cash In Flow Rp Rp Rp Rp 50.000,00 5.000,00 17.000,00 23.000,00 Page 5 of 11 CAPITAL BUDGETING TECHNIQUES Capital Budgeting Techniques. A number of techniques used to analyze the relevant cash flows to asses whether a project is acceptable or to rank projects. 1. Payback period (PP) Payback period is the exact amount of time required for a firm to recover its initial investment as calculated from cash inflows. Initial Investment In the case of annuity, Payback period = The Annual Cash Inflows In the case of mixed Stream, Payback Period must be accumulated until the Initial Investment is recovered Example. Capital expenditure data for Barnet Company. Project Initial Investment Year 1 2 3 4 5 Average A $ 42,000.00 B $ 45,000.00 $ 14,000.00 $ 14,000.00 $ 14,000.00 $ 14,000.00 $ 14,000.00 $ 14,000.00 $ 28,000.00 $ 12,000.00 $ 10,000.00 $ 10,000.00 $ 10,000.00 $ 14,000.00 Project A has annual cash inflows. $ 42.000 Initial Investment Payback period = The Annual Cash Inflows = = 3 years $ 14.000 Project B has mixed stream cash inflows B $ 45,000.00 Accumulated Cash inflows $ 28,000.00 $ 28,000.00 $ 12,000.00 $ 40,000.00 $ 10,000.00 $ 50,000.00 $ 10,000.00 $ 10,000.00 Page 6 of 11 At the end of year 3, $ 50,000.00 will be recovered. Since the amount received by the end of year 3 is greater than the initial investment of $ 45,000.00, the payback period is somewhere between two and three years. It is only $ 5,000.00 must be recovered during year 3. So, it needs 50 percent of $ 10,000.00 to complete the payback of initial investment. Therefore paybeck period for project B is 2.5 years 2. Net Present Value (NPV) Net Present Value discounts the firm’s cash flows at a specified rate called discount rate/opportunity rate/cost of capital/. NPV = Present Value of Cash Inflows – initial Investment n CFt NPV = t – Initial Investment (1+k) t 1 Annual cash inflows PVIFA, 10%, 5 years PV of cash inflows Initial Investment NPV Year 1 2 3 4 5 NPV calculation for Project A $ 14,000.00 3.791 $ 53,074.00 $ 42,000.00 $ 11,074.00 NPV calculation for Project B Cash Inflows PVIF, 10%, 5 Years $ 28,000.00 0.909 $ 12,000.00 0.826 $ 10,000.00 0.751 $ 10,000.00 0.683 $ 10,000.00 0.621 PV of cash inflows Initial Investment NPV PV $ 25,452 9,912 7,510 6,830 6,210 $ 55,914 $ 45,000 $ 10,914 3. Internal Rate of Return (IRR) IRR is the discount rate that equates the PV of cash inflows with initial investment associated with a project, thereby causing NPV = 0 n 0= t 1 CFt – Initial Investment (1+IRR)t n OR t 1 CFt = Initial Investment (1+IRR)t Page 7 of 11 IRR = k1 + NPV1 (k – k1) NPV1 - NPV2 2 Example. Capital expenditure data for Barnet Company. Project Initial Investment Year 1 2 3 4 5 Average A $ 42,000.00 B $ 45,000.00 $ 14,000.00 $ 14,000.00 $ 14,000.00 $ 14,000.00 $ 14,000.00 $ 14,000.00 $ 28,000.00 $ 12,000.00 $ 10,000.00 $ 10,000.00 $ 10,000.00 $ 14,000.00 In the case of annuity Project A $14,000.00 $14,000.00 $14,000.00 $14,000.00 $14,000.00 1 2 3 4 5 PV of cash inflows Initial Investment k1 = 18% 11864.40678 $11,666.67 10054.58202 $9,722.22 8520.832218 $8,101.85 7221.044252 $6,751.54 6119.529027 $5,626.29 43780.39429 42,000 41868.56996 42,000 1,780 -131 NPV IRR = k1 + k2 = 20% NPV1 (k – k1) NPV1 - NPV2 2 IRR = 18% + 1.780 (20% – 18%) 1.780 - (-131) IRR = 19,8% Page 8 of 11 Project B $28,000.00 $12,000.00 $10,000.00 $10,000.00 $10,000.00 1 2 3 4 5 PV of cash inflows Initial Investment NPV k1 = 18% k2 = 22% 23728.81356 22950.81967 8618.213157 8062.348831 6086.308727 5507.068874 5157.888752 4513.99088 4371.092162 3699.992525 47962.31636 45,000 44734.22078 45,000 2,962 -266 NPV1 (k – k1) NPV1 - NPV2 2 2.962 IRR = 18% + (22% – 18%) 2.962 - (-266) IRR = 21,6% IRR = k1 + Comparing NPV and IRR Techniques. For conventional projects, NPV and IRR will always generate the same acceptreject decision. The differences in their assumptions cause them to rank projects differently. 1. NPV Profiles Projects can be compared graphically by constructing NPV profiles. Example. Discount Rate 0% 10% 20% 22% NPV A $ 28,000.00 11,074.00 0 B $ 25,000.00 10,914.00 -131 0 1295 Page 9 of 11 Conflicting Rankings. Conflicting rankings dengan menggunakan NPV dan IRR karena: The magnitude of cash flows Timing of cas flows Asumsi implicit: reinvestment of intermediate ash inflows (cash inflows received prior of intermediate cash inflows). NPV: the intermediate cash inflows are reinvested at the cost of capital IRR : the intermediate cash inflows are reinvested at the rate equal to the project’s IRR Project with similar sized investment. Discount Rate Low High CASH INFLOW PATTERN Lower Early Year Cash Higher Early Year Cash Inflows Inflows Preferred Not Preferred Not Preferred Preferred Which One Is Better? Theoritical View. NPV is better approach to capital budgeting. NPV assumes that the intermediate cash inflows are reinvested at the cost of capital (reasonable estimate) than IRR at the rate equal to the project’s IRR. Page 10 of 11 Practical View Financial managers prefer to use IRR. The business manager prefers to use rate of return rather than actual dollar returns. Interest rate and profitability expressed as annual return. Approaches For Dealing With Risk. Up to this point assume that all project’ cash inflows have the same level of risk. Actually each project’ cash inflows has its risk. Risk and Cash Inflows. Risk refers to the chance that the project will prove unacceptable (NPV < 0 and IRR < CoC). Risk in capital budgeting stems from CASH INFLOWS (uncertainty), while initial investment is known with relative certainty. All components in cash inflows (sales, CGS, operating expenses) are uncertain. Analyst has to evaluate the probability that the cash inflows will be large enough to provide for project acceptance. Exp. Tyre company has 2 mutually exclusive projects (A and B). Each requires $ 10,000 initial investment (II) and provides equal annual CIF over 15 years lives. NPV = CIF * (PVIFAk,n) – Initial Investment > 0 k =10%, n = 15 years, II = $ 10,000, the breakeven cash inflows (minimum level of cash inflows) necessary for projects to be acceptable: NPV = CIF * (PVIFAk,n) – Initial Investment > 0 CIF * (PVIFA10%,15) – 10,000 > 0 CIF * (7.606) – 10,000 > 0 CIF > 10.000 = $ 1,315 7.606 Assume that the analysis results as follows: Probability of CIFA > $1,315 100% Probability of CIFB > $1,315 60% Project A less risky than project B. Page 11 of 11

