Crocs and Timberland Financial Statemetn Analysis
advertisement
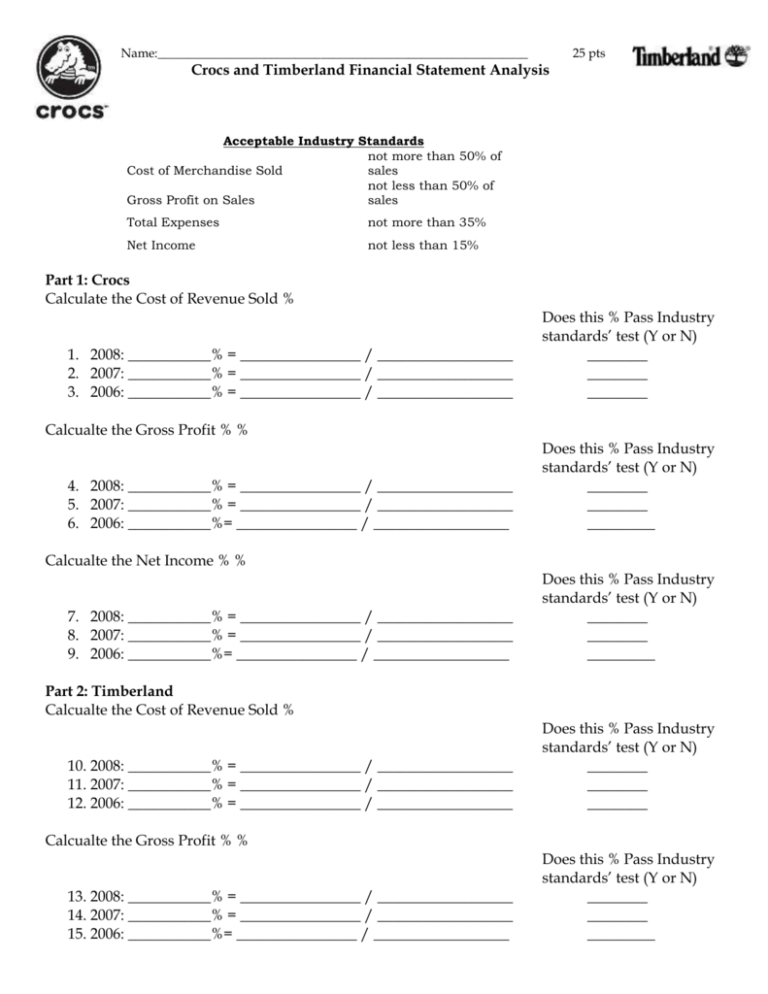
Name:___________________________________________________________ 25 pts Crocs and Timberland Financial Statement Analysis Acceptable Industry Standards not more than 50% of Cost of Merchandise Sold sales not less than 50% of Gross Profit on Sales sales Total Expenses not more than 35% Net Income not less than 15% Part 1: Crocs Calculate the Cost of Revenue Sold % 1. 2008: ___________% = ________________ / __________________ 2. 2007: ___________% = ________________ / __________________ 3. 2006: ___________% = ________________ / __________________ Does this % Pass Industry standards’ test (Y or N) ________ ________ ________ Calcualte the Gross Profit % % 4. 2008: ___________% = ________________ / __________________ 5. 2007: ___________% = ________________ / __________________ 6. 2006: ___________%= ________________ / __________________ Does this % Pass Industry standards’ test (Y or N) ________ ________ _________ Calcualte the Net Income % % 7. 2008: ___________% = ________________ / __________________ 8. 2007: ___________% = ________________ / __________________ 9. 2006: ___________%= ________________ / __________________ Does this % Pass Industry standards’ test (Y or N) ________ ________ _________ Part 2: Timberland Calcualte the Cost of Revenue Sold % 10. 2008: ___________% = ________________ / __________________ 11. 2007: ___________% = ________________ / __________________ 12. 2006: ___________% = ________________ / __________________ Does this % Pass Industry standards’ test (Y or N) ________ ________ ________ Calcualte the Gross Profit % % 13. 2008: ___________% = ________________ / __________________ 14. 2007: ___________% = ________________ / __________________ 15. 2006: ___________%= ________________ / __________________ Does this % Pass Industry standards’ test (Y or N) ________ ________ _________ Calculate the Net Income % % 16. 2008: ___________% = ________________ / __________________ 17. 2007: ___________% = ________________ / __________________ 18. 2006: ___________%= ________________ / __________________ Does this % Pass Industry standards’ test (Y or N) ________ ________ _________ Part 3: There are 9 major Indicators on Financial Statements that Stakeholder can look to in order to determine Financial Health. Use your judgment to determine these 9 indicators for either Crocs or Timberland. Company:____________________________ 1. How has the account values changed over the past 3 fiscal years…increase, decrease, consistent? a. _______________________________ 2. How do the % compare to its competitor….better, worse, the same?___________________ 3. Liquidity: Has cash increased or decreased throughout the past 3 fiscal years? ____________ a. What is the difference between the Cash amount for 2008 compared to its competitor? __________________________________ (subtract and indicate who has more cash in the bank) 4. Has the AR (net receivables) amount increased or decreased throughout the past 3 fiscal years? ____________ 5. Has the AP amount increased or decreased throughout the past 3 fiscal years? ____________ 6. How has the value of Inventory changed throughout the past 3 fiscal years? _______________ 7. Analysis of Solvency: a. What is the Net Income for the past 3 fiscal periods? i. ________________ ____________________ __________________ b. What is the Demand for products they sell, in your opinion, is it going up or down and WHY? i. 8. Debt-Equity Ratio for 2008: ______________________________ Total liabilities Total Equity Debt-Equity Ratio for 2008 for competition: )__________________________ Total liabilities Total Equity 9. Profitability Analysis (you completed this on page 1) Part 4: Cost Accountant Recommendations: 1. What are 3 ways that both retailing companies increase their Gross Profit Margin? see notes a. b. c. 2. Do you feel comfortable investing your money in this company? ______________________ 3. Which indicator helped you the most in making your decision to invest or not invest? a. _________________________________________________
